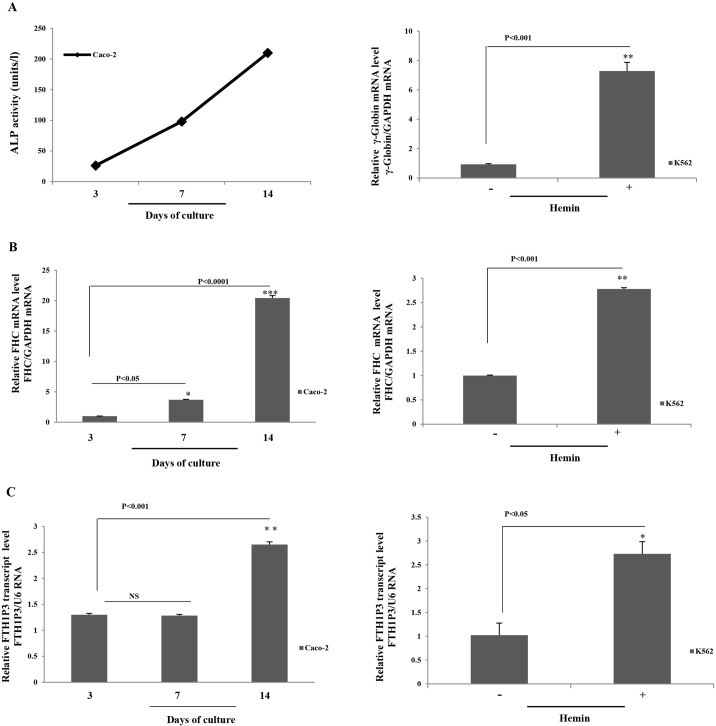
Fig 5.
Panel A. ALP activity in Caco-2 cells and qPCR analysis of γ-globin mRNA in K562 cells. Panel B. qPCR analysis of FHC mRNA in Caco-2 and in K562 cells. Panel C. qPCR analysis of FTH1P3 transcript in Caco-2 and in K562 cells. Data are the mean ± SD of three independent experiments (*p<0.05; **p<0.001; ***p<0.0001). NS: p value not significant.

