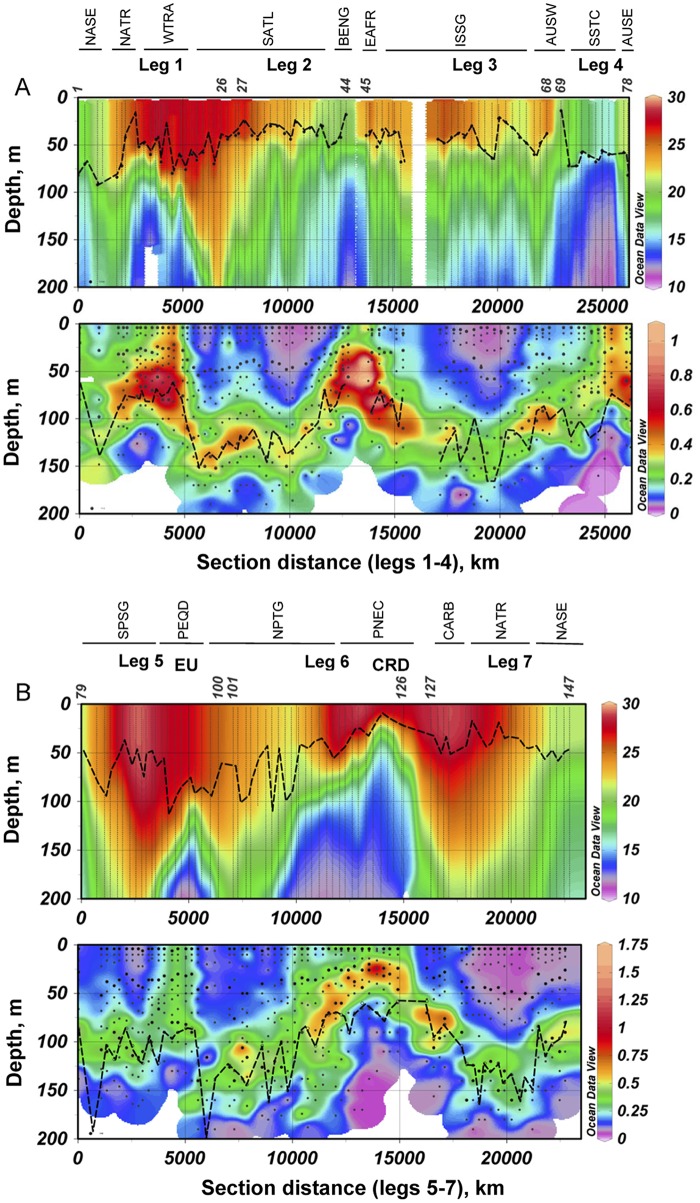
Fig 2. Distributions of temperature and Chl a concentration along the Malaspina-2010 cruise.
(A) Temperature (°C). (B) Chl a (mg m-3). The dashed lines indicate the mixed layer depth in (A) and the 1% light level in (B). The dots in (B) indicate the Chl a sampling depths; the larger dots correspond also to phytoplankton samples. The different legs and the provinces crossed are shown on top of the figure. EU = Pacific Equatorial Upwelling, CRD = Costa Rica (or Mesoamerican) Dome. The numbers of the initial and final station of each leg are indicated on top of the temperature graph.

