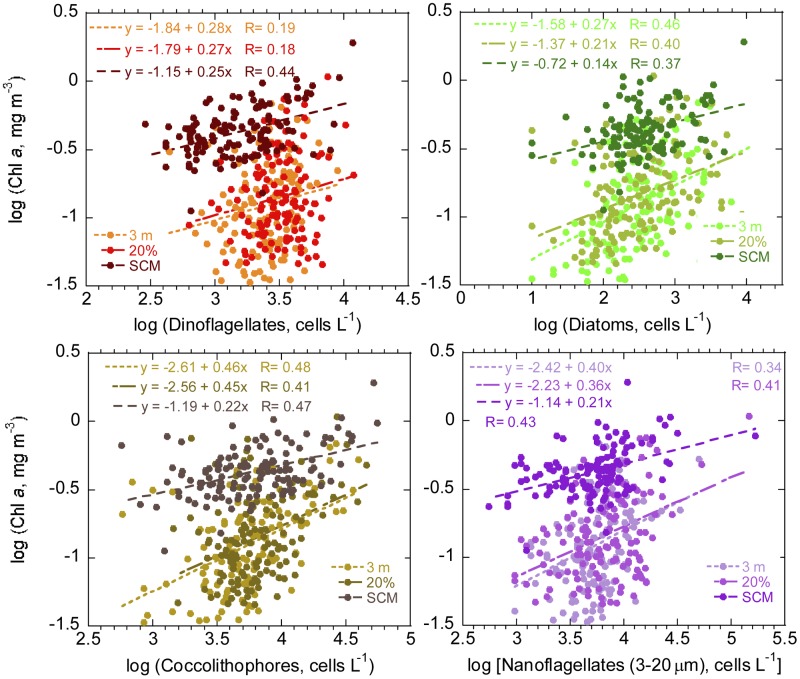
Fig 4. Relationships between abundance of major phytoplankton groups (cells L-1) and Chl a (mg m-3) concentration.
Top left, dinoflagellates. Top right, diatoms. Bottom left, coccolithophores. Bottom right, “Unidentified nanoflagellates (3–20 μm)”. The three sampling depths (3 m, 20% light level and SCM) are indicated by different colours. The corresponding regression lines (dashed) and equations are indicated.

