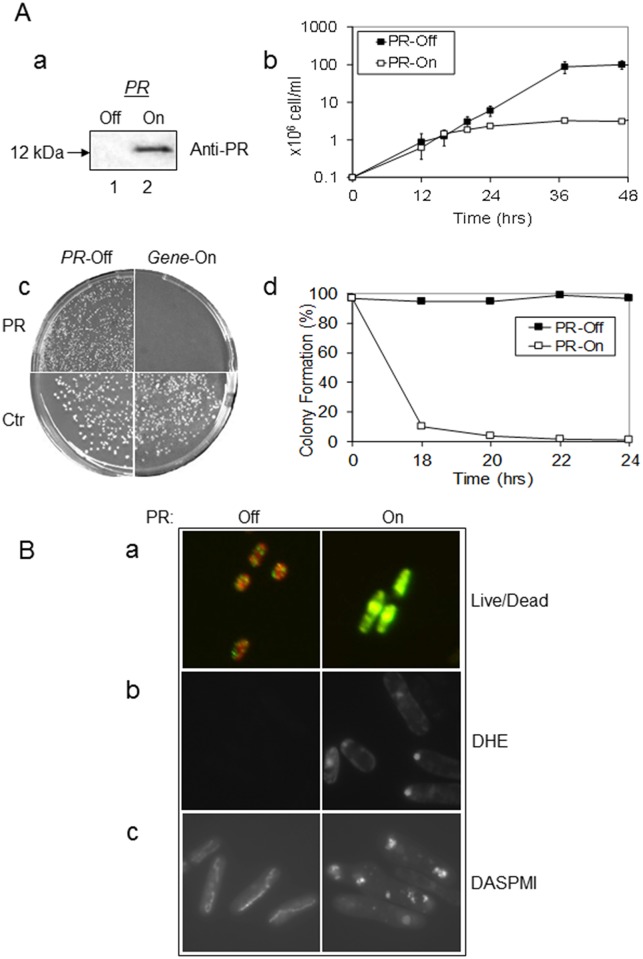
Fig 1. Expression of the HIV-1 PR gene prevents cellular growth and causes oxidative stress, changes of mitochondrial morphology, and cell death in fission yeast.
(A) Inducible expression of the HIV-1 PR gene in RE294 was detected 24 hrs after gene induction by western blot analysis (a). Lane 1, PR-repressing cells; lane 2, PR-inducing cells. Blot shows a 12-kDa protein band that specifically reacted to an antiserum against HIV-1 PR. Expression of the PR gene induced cellular growth arrest in liquid medium (b) and prevented yeast colony formation on agar plates (c) and in liquid medium (d). PR-off, i.e., no PR protein production. PR-on, i.e., PR protein production. All cells were grown at 30°C, and the cell growth was measured at OD650 in the time period shown using a spectrophotometer. Pictures of agar plates were taken 6 days after incubation at 30°C under the indicated conditions. Error bars shown in (b) of the growth assay represent at least three independent experiments. (B) HIV-1 PR expression induced cell death (a), oxidative stress (b), and mitochondrial morphological changes (c) in fission yeast. Twenty-four hours after inducible PR expression, cell viability was measured by the yeast live/dead assay [30, 33] (a). In this assay, viable cells are typically shown in orange-red color (left, PR-off); metabolically deceased cells are shown in green-yellow color (right, PR-on). The production of reactive oxygen species (ROS) was measured by an ROS indicator dye DHE (b). Mitochondrial morphologies (c) were visualized by staining fission yeast cells with a mitochondria-specific fluorescent probe, DASPMI, as previously described [22, 36]. Note that normal mitochondria appear like a thread or necklace of multiple small dots concentrated around the edge a cell, at the growing ends of the cell, or as a tubular network extended along the periphery of the cell (Fig 1B-b, left). In contrast, different sizes of mitochondrial aggregates that are situated almost randomly throughout the PR-expressing cells are shown here, indicating changes in mitochondrial morphology (Fig 1B-b, right).

