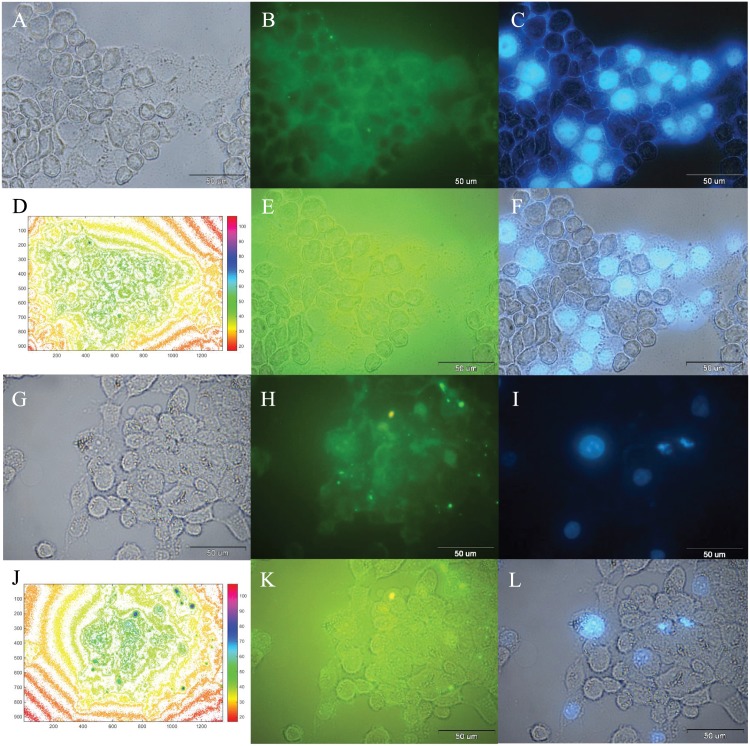
Fig 9. Optical microscopy images of incubated cells by SF-loaded FITC/FA@[Fe3O4@Au] NPs after 24 and 72 h.
A: bright-field image, B: fluorescence image of FITC detection, and C: fluorescence image of DAPI detection of the same area after 24 h incubation of MCF-7 cells with SF-loaded FITC/FA@[Fe3O4@Au] NPs. D: The corresponding fluorescence intensity maps (colorbar shown) of FITC (in SF-loaded FITC/FA@[Fe3O4@Au] NPs) distribution of Fig 9B. E: Combined of A and B. F: Combined of A and C. G: bright-field image, H: fluorescence image of FITC detection, and I: fluorescence image of DAPI detection of the same area after 72 h incubation of MCF-7 cells with SF-loaded FITC/FA@[Fe3O4@Au] NPs. J: The corresponding fluorescence intensity maps (colorbar shown) of FITC (in SF-loaded FITC/FA@[Fe3O4@Au] NPs) distribution of Fig 9B. K: Combined of G and H. L: Combined of G and I.

