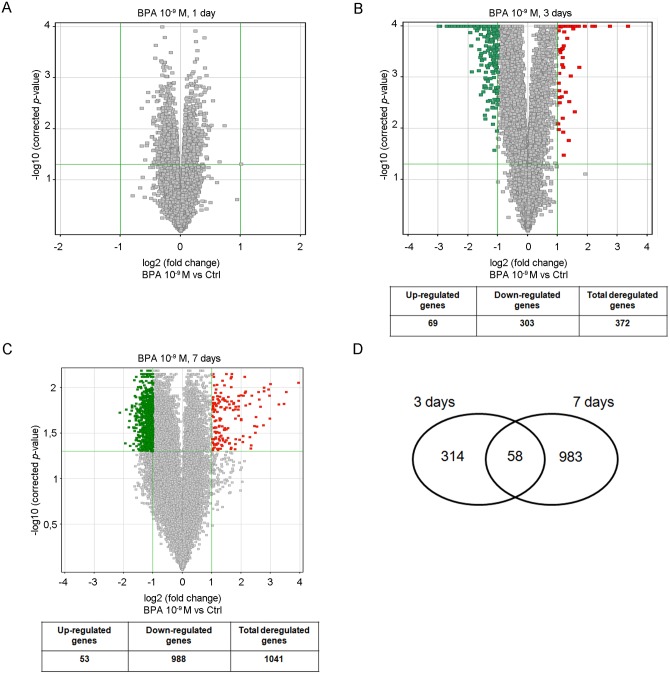
Fig 1. Time-dependent transcriptome perturba4tion induced by low-dose BPA in FRTL-5 cells.
Volcano plots of microarray data after 1-day (A), 3-day (B) and 7-day (C) treatment with 10−9 M BPA compared to untreated cells. The y-axis value is the negative logarithm (base 10) of the corrected p-value. A green horizontal line on the plot represents the significant threshold for p-value. The x-axis is shown as the logarithm (base 2) of the FC in expression level between treated and control cells. The vertical green lines on the plot represent the thresholds for FC. Red dots are up-regulated probes; green dots are down-regulated probes. The number of down/up-regulated genes for each Volcano plot is reported in the underlying table. (D) Venn Diagram showing the gene set overlap between 3- and 7-day treatments.

