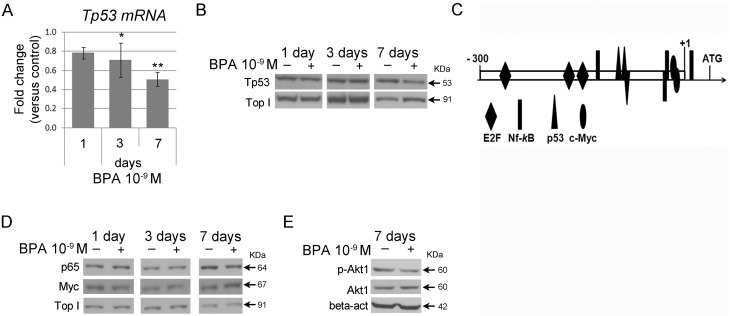
Fig 3. Tp53 and TF regulation following BPA treatment in FRTL5 cells.
(A) qRT-PCR analysis of Tp53 transcript in FRTL-5 cells after 1-, 3-, and 7-day treatment with 10−9 M BPA. Data are reported as the ratio between transcript levels in BPA-treated and control samples. The mean ± standard deviation of three independent experiments is reported. *p-value <0.05; **p-value <0.01. (B) Western blot analysis of Tp53 nuclear protein levels in FRTL-5 cells after 1-, 3-, and 7-day treatment with 10−9 M BPA. (C) Schematic representation of Tp53 promoter (-300/+130bp), depicting binding sites for TF predicted modulated by IPA. (D) Western blot analysis of p65 and c-Myc nuclear protein levels in FRTL-5 cells after 1-, 3-, and 7-day treatment with 10−9 M BPA. Topoisomerase I was used as loading control. Data are representative of three independent experiments (see S4 Fig). (E) Western blot analysis of p-Akt (Ser 473) and Akt in FRTL-5 cells after 7-day treatment with 10−9 M BPA. β-actin was used as loading control. Data are representative of three independent experiments (see S4 Fig).

