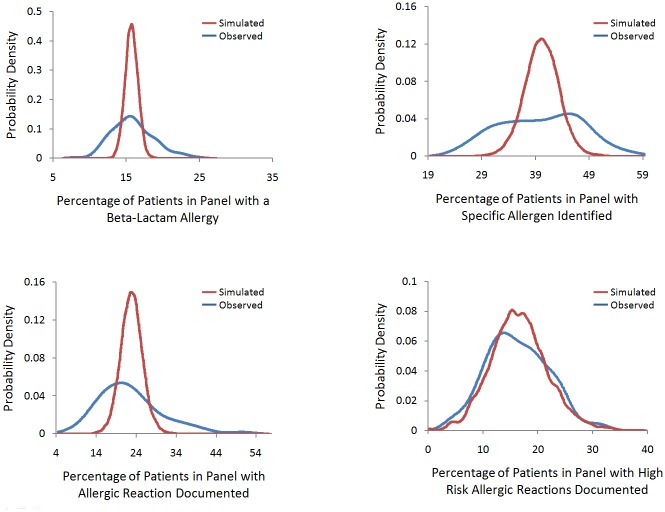
Fig 2.
a-d. Observed vs. simulated expected frequency distribution of the percentage of patients with a beta-lactam allergy (Fig 2a), a specific beta-lactam allergen identified (Fig 2b), with characteristics of a beta-lactam reaction documented (Fig 2c) and with a high-risk beta-lactam allergic reaction documented (Fig 2d) by physician cohort. In the simulation, expected distribution was determined by holding patient panel size constant and randomly assigning patients as either having or not having the event based on the global event rate of all the patients in the study. The simulation was repeated 100 times and the distribution of the percentage of events in each physician’s patient panel was calculated. Levene’s test was used to compare the equality of variance between the observed and expected distributions.

