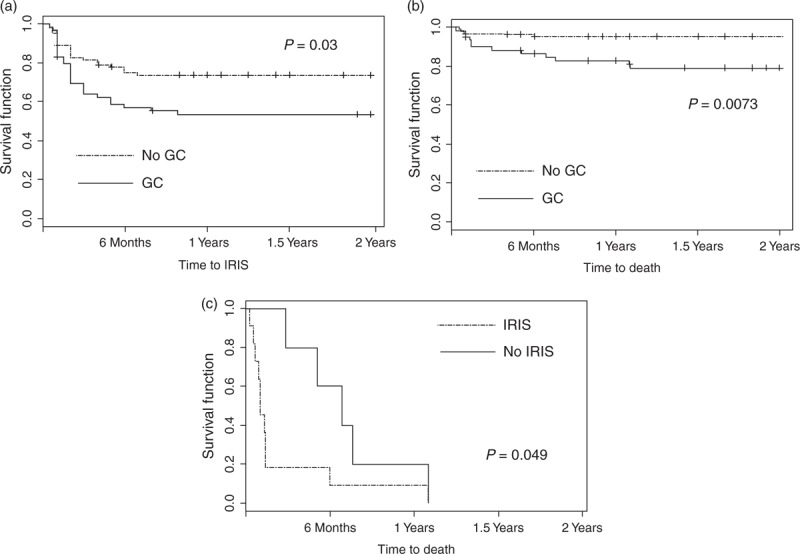
Fig. 1.
Kaplan–Meier survival curves.

(a) Time to IRIS for individuals treated with glucocorticoids (solid line), and individuals nontreated with glucocorticoids (dotted line). (b) Time to death for individuals treated with glucocorticoids (solid line), and individuals nontreated with glucocorticoids (dotted line). (c) Time to death regardless of glucocorticoid use for individuals without IRIS (solid line), and individuals with IRIS (dotted line). Only individuals experiencing Kaposi's sarcoma-associated death were included. Time 0 corresponded to Kaposi's sarcoma diagnosis. Vertical tick marks indicate right censoring. IRIS, immune reconstitution inflammatory syndrome.
