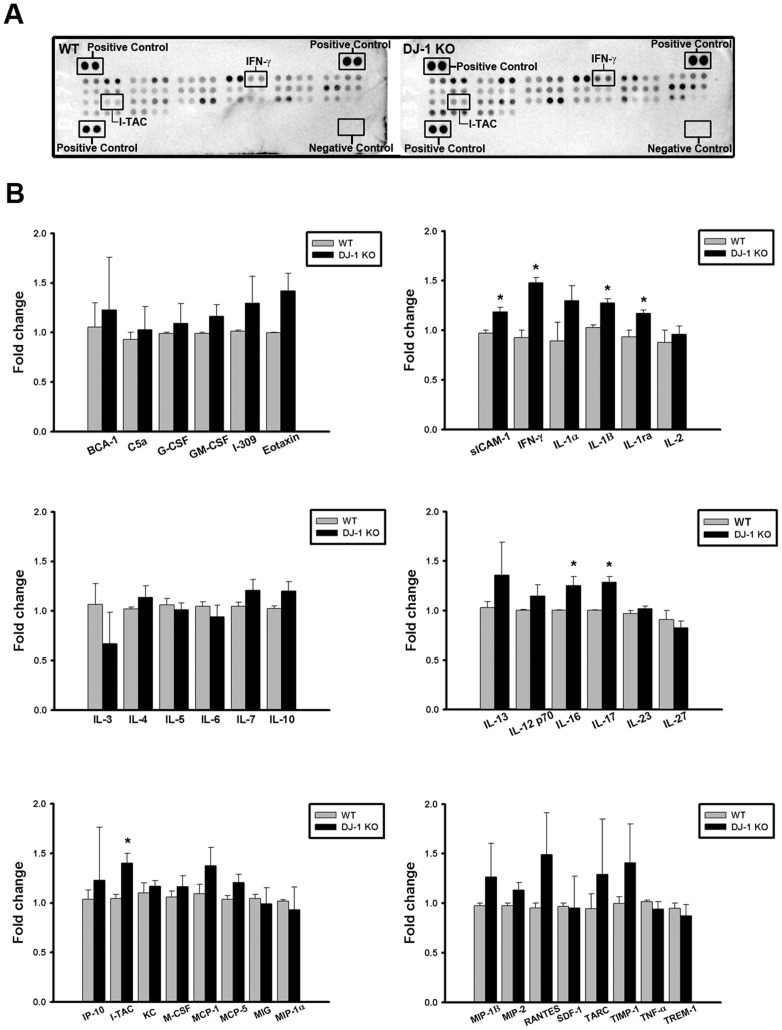
Fig 1. Increase of cytokines/chemokines expression in the substantia nigra of DJ-1 KO mice.
(A) Cytokine arrays were used to evaluate the cytokine/chemokine contents. Representative array images showed the cytokine and chemokine profiles of substantia nigra protein extracts (200 μg) in WT (left) and DJ-1 KO (right) mice. (B) Bar charts showed the protein levels of WT and DJ-1 KO groups. Data were normalized as fold change of the respective protein spots in WT mice and presented as mean ± S.E.M. (n = 3 for each group) * p<0.05.

