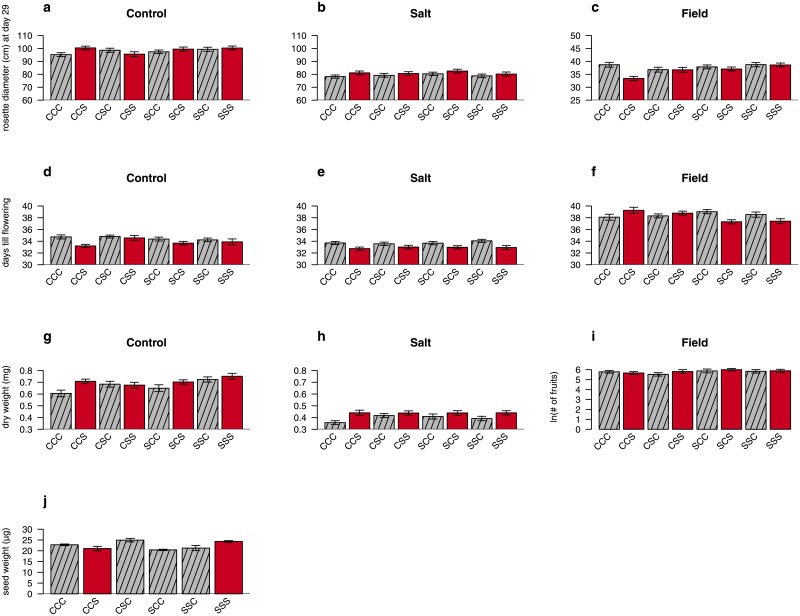
Fig 2. Expression of offspring phenotypes in three different environments after exposure of parental, grandparental and/or great-grandparental generations to salt stress.
Panels a, b and c show rosette diameter (mm); panels d, e and f show flowering time (days); panels g, h, i show biomass (mg) or number of fruits (mean ± sem) for respectively climate chamber control, climate chamber salt and field environment. Panel j shows average seed weight, which only shows six experimental groups because of limited seed availability. Significant differences between groups are shown in Table 2. The striped grey bars indicate that the parents of the experimental plants were grown under control conditions. The red bars indicate that the parents of the experimental plants were grown under salt stress.

