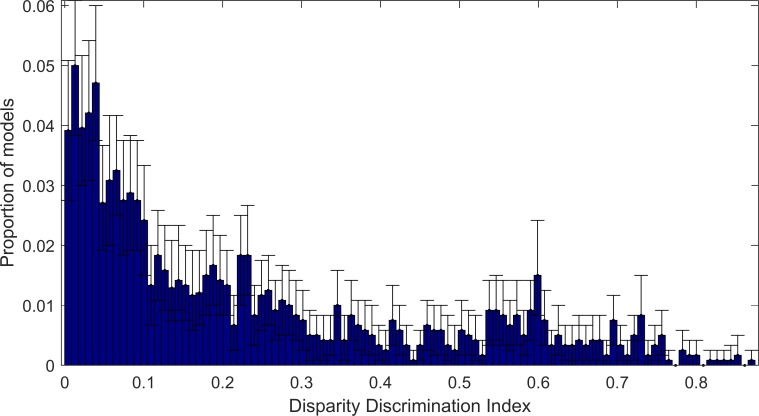
Fig 10. Distribution of DDI scores for max-pooled complex cell models.
The distribution of DDI scores is bootstrapped 200 times to produce 95% Confidence Intervals (vertical black lines) and median scores (blue boxes) for each cell in a histogram. The max-pooling model exhibits a wide range of binocular disparities between 0 and 0.8743.

