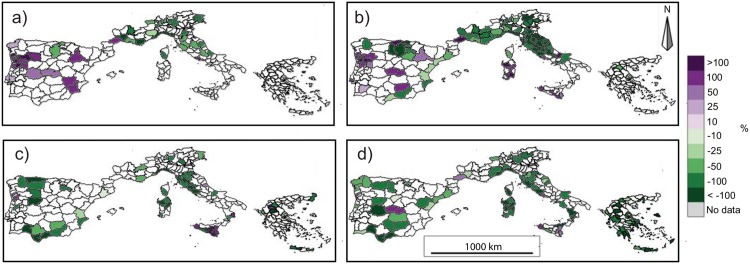
Fig 7.
Seasonal trends of the burned area for the period 1985-2011 for (a) December-January-February (DJF), (b) March-April-May (MAM), (c) June-July-August (JJA) and (d) September-October-November (SON). NUTS3 units with more than 5 years of missing data are excluded from the analysis. Only significant trends (p < 0.05) are shown. Trends are represented as the percentages of the total trend for the available period (e.g. ha per 27 years) divided by the historical mean calculated over the same period (e.g. 1985-2011).

