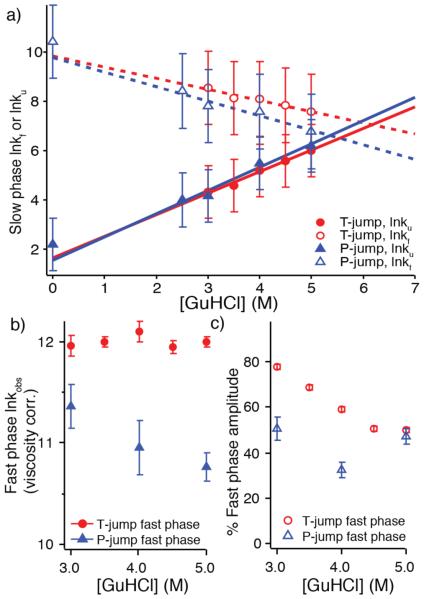
Figure 2.
Experimental kinetics summary. a) Chevron plot illustrating the GuHCl dependence of the slow phase folding and unfolding rates. Rates are linearly extrapolated without viscosity correction.28 Error bars include fit error from thermodynamic values and standard error from averaging kinetic fit parameters. b) Observed, solvent viscosity scaled relaxation rate of the fast phase for T- and P-jump (k in units of s−1, ln is the natural logarithm, error is standard error). c) The percentage of the amplitude corresponding to the fast phase. For both b) and c), error is standard error from averaging fitted values across multiple experimental traces.

