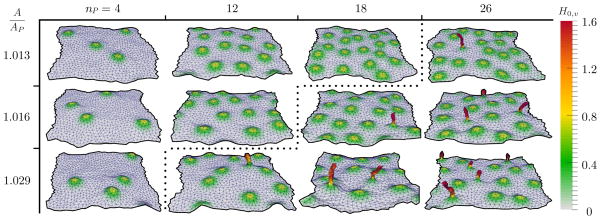
FIG. 1.
(Color online) Representative snapshots of equilibrium membrane morphologies as a function of nP and A/Ap. The membrane surfaces are colored based on the value of H0,v (expressed in units of ): An isolated Gaussian bump represents an individual protein field while tubules, formed by the aggregation of multiple protein fields, are seen as sharp protrusions. All protein fields shown have the parameters and .

