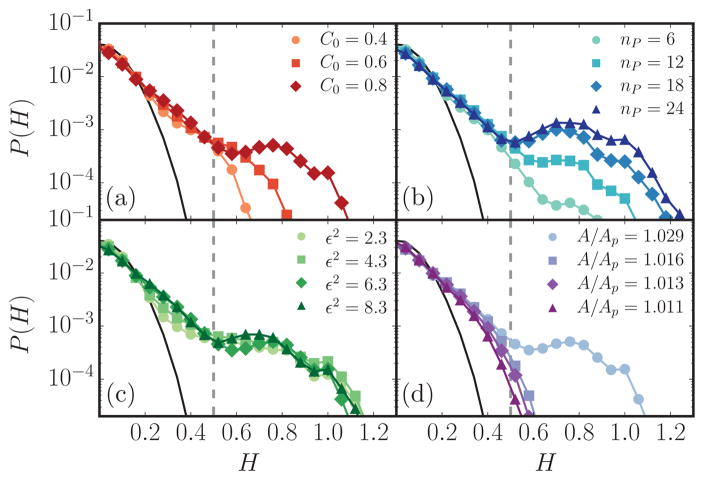
FIG. 3.
(Color online) Histograms of mean curvature for simulations with (a) a range of peak spontaneous curvatures C0, (b) several protein concentrations nP, (c) a range of curvature field extents ε2, and (d) several different membrane excess areas A/Ap. All panels have the parameters , nP = 14, and A/Ap = 1.029 unless otherwise stated. A mean curvature cutoff of is shown as a vertical dotted line.

