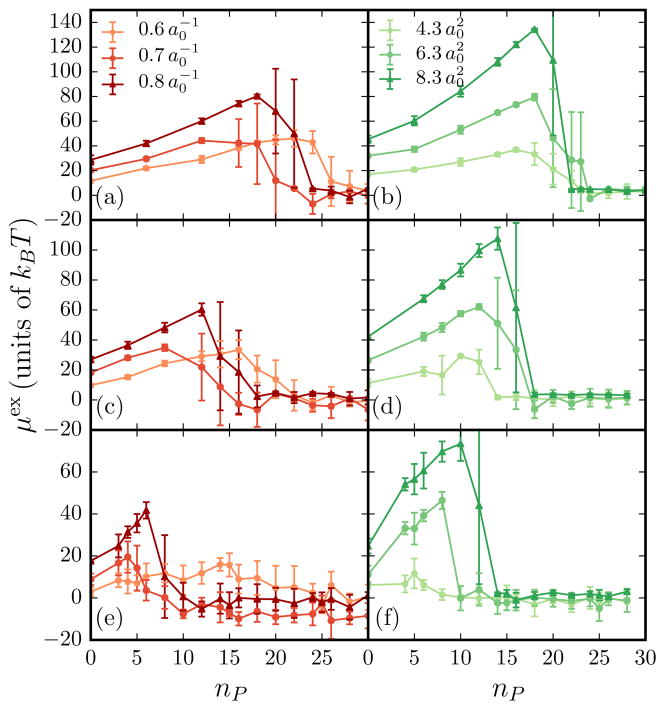
FIG. 5.
(Color online) Plot of the excess chemical potential vs protein number for a range of both C0 and ε2 for several initial excess areas. Solid lines with correspond to while points with error bars correspond to μex. Data are depicted for a range of C0 with and corresponding excess areas (a) A/Ap = 1.013, (c) A/Ap = 1.016, and (e) A/Ap = 1.029 and for a range of ε2 with and corresponding excess areas (b) A/Ap = 1.013, (d) A/Ap = 1.016, and (f) A/Ap = 1.029. The values of are similar to that of μex and hence are not shown for clarity.

