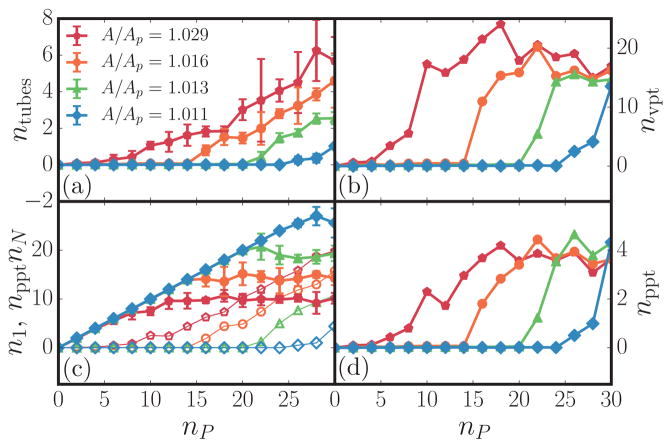
FIG. 6.
(Color online) Plot of several different tube statistics including (a) the average number of tubes at each concentration for several excess areas ntubes, (b) the average number of vertices per tubule nvpt, (c) the average number of monomers n1 and oligomers npptnN in simulation where monomers represent all proteins on the basal part of the membrane (closed symbols) and the n-mers represent all proteins in tubules (open symbols), and (d) the average number of proteins per tubule nppt. The legends in the panels correspond to four different values of A/Ap.

