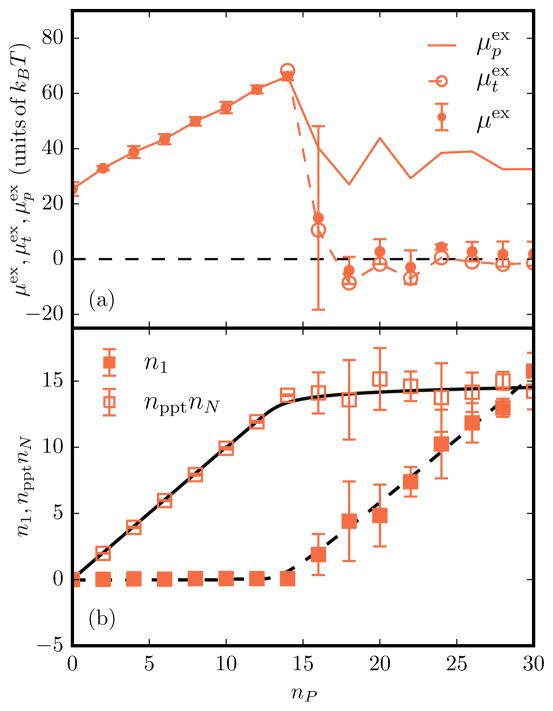
FIG. 7.
(Color online) (a) Various excess chemical potentials as a function of nP for A/Ap = 1.016, C0 = 0.8, and ε2 = 6.3. The closed symbols with error bars denote μex, open symbols with dotted lines represent , and solid lines correspond to . (b) Total number of protein fields in the planar n1 and tubular npptnN regions as a function of nP. Here nppt corresponds to the average number of protein fields per tubule. The solid and dashed black lines are the analytical fits to the micelle model described in Eq. (15).

