
Fig. 3. Comparative LUM015 pharmacokinetics in mouse and human subjects.
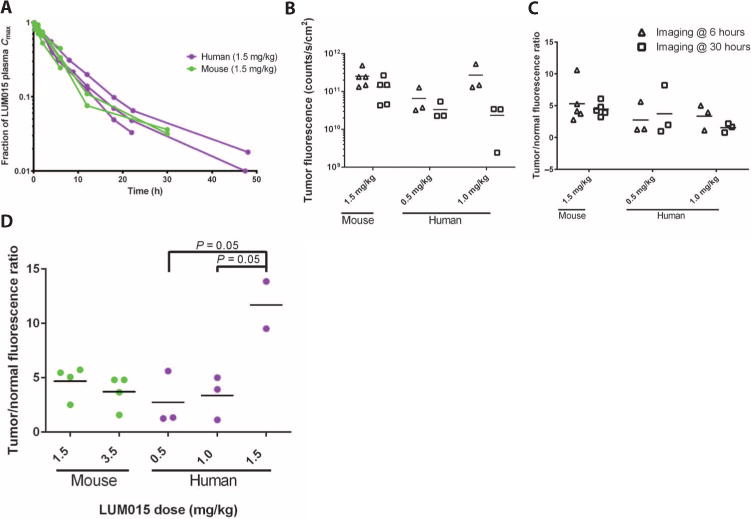
(A) LUM015 plasma clearance profile in mouse and human subjects administered a 1.5 mg/kg dose of LUM015. [LUM015]plasma is given as a fraction of the maximum concentration and shown on a log scale. (B) Tumor fluorescence in patients and mice at the 6- and 30-hour imaging time points (n = 5 mice and 3 humans per dose cohort). P = 0.02 for imaging time, as determined by two-way analysis of variance (ANOVA). (C) Tumor/normal fluorescence ratio in mice and humans at the 6- and 30-hour imaging time points. P = 0.6 for imaging time, as determined by two-way ANOVA. (D) Tumor/normal fluorescence ratio measured in humans and mice by dose (nmouse-1.5, 3.5 = 5; nhuman-0.5, 1.0 = 3; nhuman-1.5 = 2). P values for dose cohort comparisons determined by Tukey’s multiple comparisons test. P = 0.02 for dose effect on human subset determined by one-way ANOVA.