Figure 4.
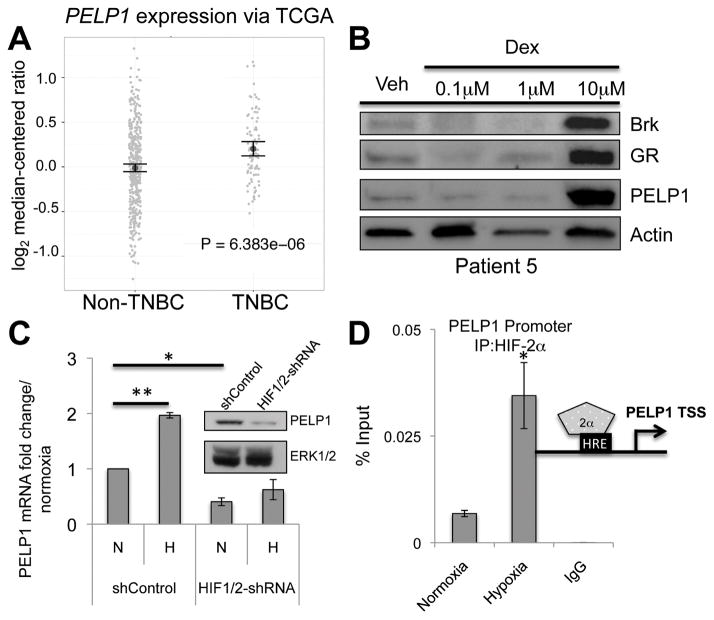
Hypoxic cell stress induces PELP1 expression. (A) PELP1 mRNA levels (via TCGA) comparing non-TNBC to TNBC tissues. (B) Primary human TNBC explants were treated with for 24hrs with vehicle or increasing doses of dex and subjected to Western blot analysis for Brk, GR, PELP1, and Actin (loading control). A representative patient explant is shown (n=7). (C) MDA-MB-231 shControl or HIF1/2-shRNA cells were cultured at normoxia or hypoxia for 24hrs and mRNA levels were assessed via qRT-PCR after normalization to TBP levels and shControl cell normoxia values. Inset, Western blot analysis showing PELP1 and ERK1/2 (loading control). (D) MDA-MB-231 cells were cultured at normoxia or hypoxia for 1hr and ChIP assays were performed. Negative isotype-matched controls were conducted on MDA-MB-231 cells cultured at hypoxia (1 hr). Representative examples from triplicate experiments are shown. (*p<0.05, **p<0.01; unpaired Student t test).

