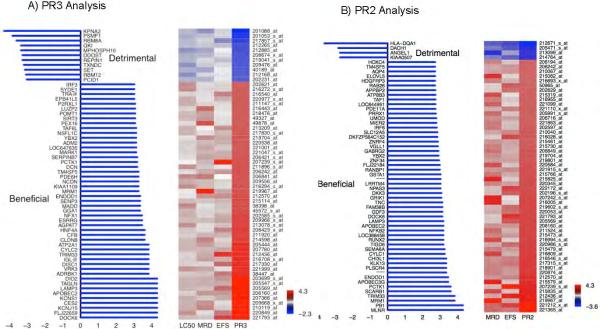
Figure 2.
Therapeutically beneficial and detrimental patterns of association detected by the PROMISE method. A) The three-endpoint PROMISE analysis (PR3) identified 65 probe sets with cytarabine induced changes in expression levels that showed a beneficial or detrimental pattern of association with in vitro LC50, MRD and EFS. B) The two-endpoint PROMISE analysis (PR2) identified 30 probe sets with cytarabine induced change in expression levels that showed beneficial or detrimental patterns of association with MRD and EFS. X-axis values give a log10 p-value with sign defined by the pattern (negative for detrimental and positive for beneficial). Each row represents a gene and each column represents a clinical endpoint: MRD and EFS; PR2 indicates the statistical values corresponding to the PROMISE analysis. Colors are assigned according to the signed log10 p-value. EFS: Event-free survival; MRD: Minimal residual disease; PROMISE: Projection onto the Most Interesting Statistical Evidence.

