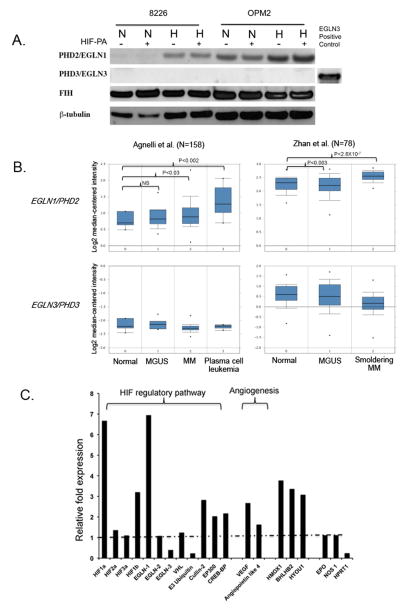
Figure 2.
There is differential expression of HIF regulatory pathway in 8226 cells. (A) Immunoblots of PHD2/EGLN1, PHD3/EGLN3 and FIH in 8226 cultured under normoxic or hypoxic conditions (0.1% O2, 5% CO2) for 48 hours in the presence or absence of HIF-PA (10 μM). Cells were harvested on ice and the cell lysate was immunoblotted. A positive immunoblot control (an over expression lysate from HEK293T cells) for PHD3/EGLN3 is included. The data presented are a representative immunoblots of at least 2 independent experiments. (B) Boxplot results showing a meta-analysis of PHD2/EGLN1 and PHD3/EGLN3 in normal bone marrow, monoclonal gammopathy of undetermined significance (MGUS), multiple myeloma, smoldering myeloma and plasma cell leukemia. Analysis was performed using Oncomine and includes two data sets: Angelli et al (N=156) and Zhan et al (N=78). (C) Relative fold change in hypoxia-mediated expression of select genes compared to normoxic conditions. The 8226 cells were cultured under normoxic or hypoxic (0.1% O2, 5% CO2) conditions for 24 hours. The RNA was collected and gene expression was determined by quantitative real-time PCR analysis. The relative fold change in hypoxia-mediated gene expression compared to normoxic levels are shown. Values above the dotted line indicate upregulation of genes by hypoxia, and values below the dotted line indicate downregulation of genes by hypoxia. These data are representative of 2 independent experiments.

