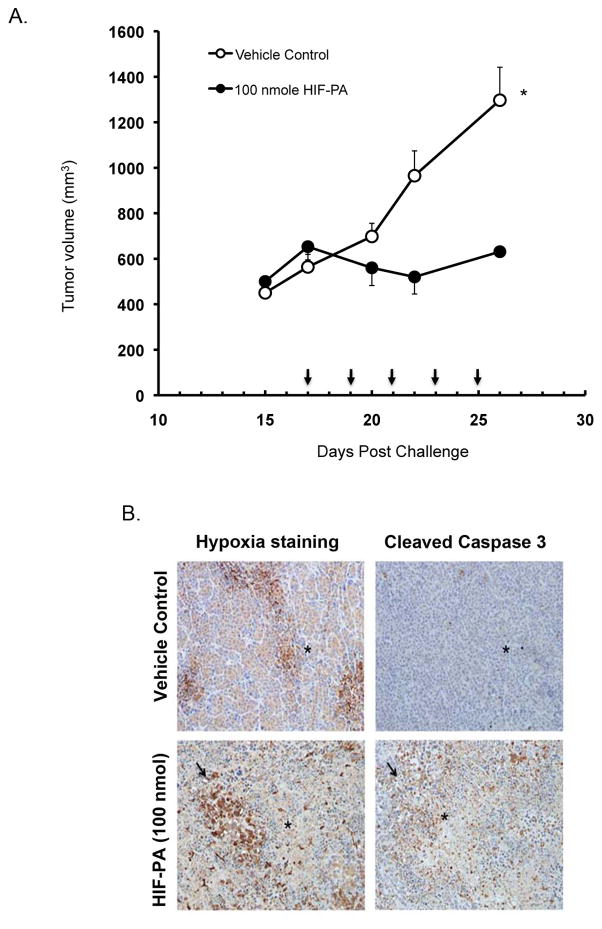
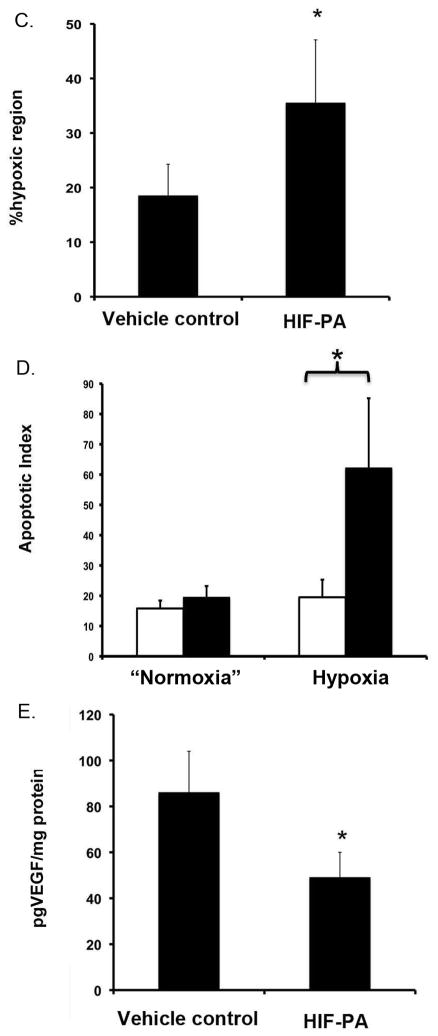
Figure 5.
HIF-PA (100nmol/kg mouse) inhibits 8226 tumor growth in a subcutaneous (SQ) myeloma xenograft model (N=10 mice/group). (A) Change in 8226 tumor volume in HIF-PA-treated NOD/SCID mice. Mice were challenged SQ with 10×106 cells admixed in matrigel. When the tumor volume was ~500 mm3 (~day 15 post challenge), the mice were randomized into treatment and control groups (10 mice/group). The mice were given 5 IP injections at indicated concentration (Arrows indicate days of treatment) and the tumor volume was measured using calipers. Values represent mean volume ± 95% confidence interval. *P<0.05. (B) Photomicrographs of SQ tumor sections harvested from mice treated with HIF-PA or vehicle-control treated mice (N=10 mice/group). Tumors were harvested 24 hours after last the IP injections. Serial tumor sections were stained for hypoxia (by pimonidazole; brown stained areas) or apoptosis (cleaved caspase 3). *Indicate corresponding geographic regions in the sections. Arrow indicates areas of hypoxia and associated apoptosis. (C) The percent area of hypoxic tumor bed measured by staining with pimonidazole (measured in 10 fields/tumor, 10 tumors/group) in 8226 tumors harvested from HIF-PA or vehicle-treated mice. Area was measured using Metamorph computer software. Values are presented as mean ± 1 standard deviation. *P<0.05. (ANOVA) (D) Apoptotic index (the number of apoptotic cells/unit area) was measured by counting cells staining for cleaved caspase 3 (10 fields/tumor, 10 tumors/group). The apoptotic index in regions of “normoxia” or “hypoxia” were assayed by using serial sections stained with pimonidazole to identify specific geographical areas in the tumor nodules. Values are presented as mean ± 1 standard deviation. *P<0.05 (ANOVA). (E) Tumor lysate was collected and VEGF was analyzed by ELISA (10 tumors/group). Values are presented as mean ± 1 standard deviation. *P<0.05 (T-test).


