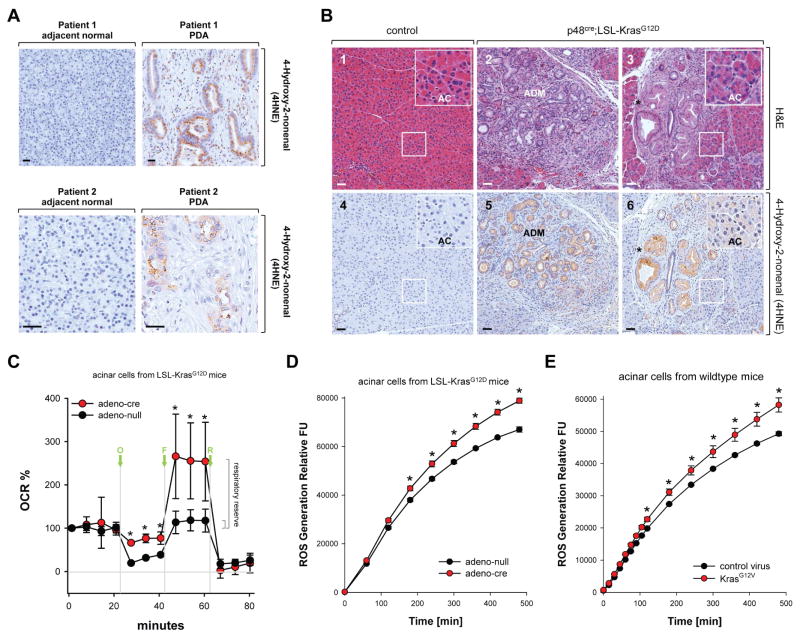
Figure 1. Oxidative stress levels are increased in pancreatic cells expressing oncogenic Kras.
A: Patient samples (adjacent normal and PDA) were analyzed by immunohistochemistry using anti-4HNE (4-Hydroxy-2-nonenal) as a marker for oxidative stress. Shown is a characteristic area of the pancreas. The bar indicates 50 μm. B: Pancreatic sections from control mice (n=5; shown are LSL-KrasG12D) or mice (n=5) expressing the LSL-KrasG12D allele under the p48 promoter (p48cre;LSL-KrasG12D) were analyzed by immunohistochemistry (1–3: H&E staining, 4–6: staining with anti-4HNE). Shown is a characteristic area of the pancreas. AC = acinar cells, ADM = region of acinar-to-ductal metaplasia and PanIN lesions. The asterisk indicates an area with PanIN1 lesions with increased oxidative stress. The insert in 6 demonstrates that acinar cells of p48cre;LSL-KrasG12D mice already have increased levels of intracellular oxidative stress. The bar indicates 50 μm. C: Primary mouse pancreatic acinar cells were isolated either from LSL-KrasG12D mice and adenovirally-infected with adeno-null or adeno-cre. Briefly, 48 hours after infection, the oxygen consumption rate (OCR) over time was measured as described in Materials & Methods. Shown is a representative experiment (out of 3 independent experiments) performed with triplicates for each condition. Oligomycin (O; 2 μM), FCCP (F; 1 μM), and rotenone (R; 0.5 μM) were added at indicated time points. Error bars represent variations between triplicates. * indicates statistical significance (p<0.05) as compared to the control (adeno-null). D, E: Primary mouse pancreatic acinar cells were isolated either from LSL-KrasG12D mice (D), or wildtype mice (E). Cells were then adenovirally-infected with adeno-null or adeno-cre (D), or lentivirally-infected with control virus or virus harboring oncogenic KrasG12V (E). 48 hours after infection, cells were labeled with H2DFFDA and generation of intracellular ROS (fluorescent DCF) was measured over a time period of 500 minutes. * indicates statistical significance (p<0.05) as compared to the control (adeno-null in D; control virus in E).

