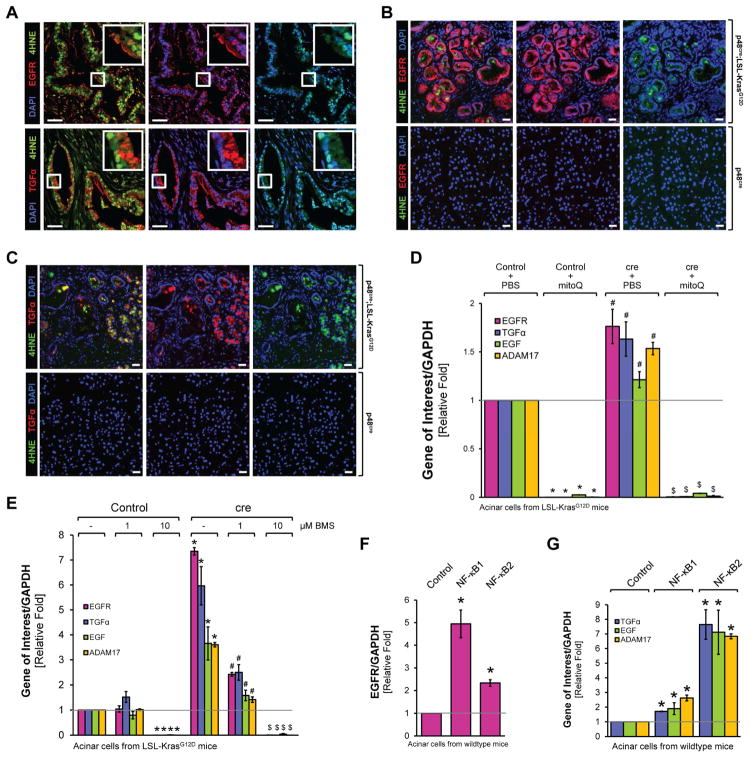
Figure 4. Oncogenic Kras upregulates expression of EGFR, its ligands and their sheddase ADAM17 through NF-κB.
A: Pancreatic cancer patient samples were analyzed for 4HNE and EGFR (top panel) or 4HNE and TGFα (bottom panel) using immunofluorescent labeling. Nuclei were visualized by DAPI staining. The first set of pictures shows a composite of 4HNE with EGFR or TGFα. The second and third pictures show EGFR, TGFα or 4HNE combined with DAPI. Rectangular windows show zoom in areas. Scale bar is 50 μm. B, C: Pancreatic sections from control mice (shown are p48cre) or mice expressing the LSL-KrasG12D allele under the p48 promoter (p48cre;LSL-KrasG12D) were analyzed by immunofluorescence for expression of EGFR and 4HNE (A) or TGFα and 4HNE (B). Nuclei were stained with DAPI. Shown is a characteristic area of the pancreas. The bar indicates 25 μm. D: Primary mouse pancreatic acinar cells were isolated from LSL-KrasG12D mice, infected with adeno-null (labeled: control) or adeno-cre (labeled: cre), and then seeded in 3D collagen explant culture in presence of MitoQ (500 nM). At day 5, cells were isolated from collagen and expression of murine EGFR, TGFα, EGF and ADAM17 was analyzed using quantitative PCR. * indicates statistical significance (p<0.05) as compared to PBS-treated control; # as compared to PBS-treated control and KrasG12D-expressing cells. E: Primary mouse pancreatic acinar cells were isolated from LSL-KrasG12D mice, infected with adeno-null (labeled: Control) or adeno-cre (labeled: cre), and then seeded in 3D collagen explant culture in presence of BMS345541 (labeled: BMS) at indicated doses. At day 5, cells were isolated from the collagen and expression of murine EGFR, TGFα, EGF and ADAM17 was analyzed using quantitative PCR. * indicates statistical significance (p<0.05) as compared to untreated control; # as compared to untreated KrasG12D-expressing cells; and $ as compared to untreated control and to KrasG12D-expressing cells. F, G: Primary mouse pancreatic acinar cells were isolated from wildtype mice, infected with adenovirus harboring control (null), NF-κB1 or NF-κB2, and then seeded in 3D collagen explant culture. At day 5, cells were isolated from the collagen and expression of murine EGFR (F), or TGFα, EGF and ADAM17 (G) was analyzed using quantitative PCR. In F and G, * indicates statistical significance (p<0.05) as compared to control.

