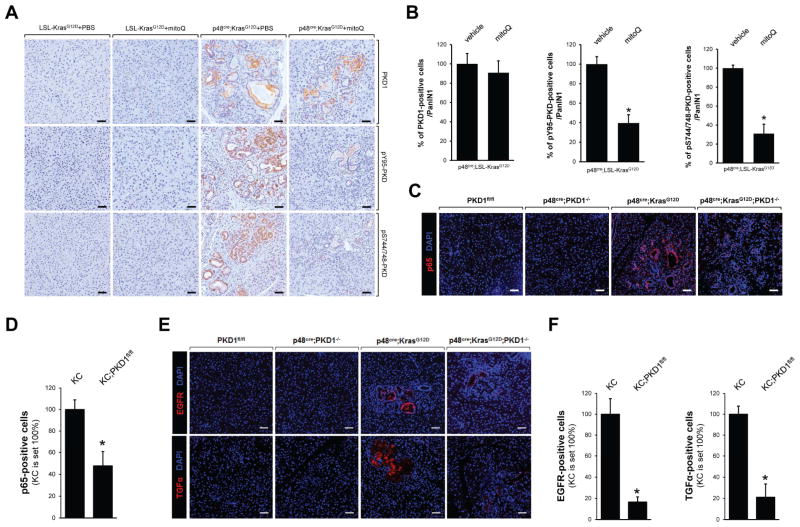
Figure 6. Protein Kinase D1 is downstream of KrasG12D-mediated ROS.
A, B: Control mice (LSL-KrasG12D) or p48cre;LSL-KrasG12D mice treated with MitoQ or vehicle (from experiment shown in Fig. 5A) were analyzed by IHC for expression of PKD1, or PKD phosphorylations indicative for its activation by oxidative stress (pY95-PKD) or general activity (pS744/748-PKD). Scale bar in A is 50 μm. B shows quantifications (% of positive cells per PanIN1). * indicates statistical significance (p<0.05) as compared to vehicle-treated mice. C, E: Pancreas sections from p48cre;KrasG12D;PKD1−/− and control mice at an age of 8 weeks were analyzed by immunofluorescence staining for p65 (C) or EGFR and TGFα (E). Nuclei were visualized by DAPI staining. Scale bar: 50 μm. D, F: Quantifications of cells expressing p65 (D); and EGFR or TGFα (F) in abnormal structures (ADM, PanIN). * indicates statistical significance (p<0.05) as compared to p48cre;KrasG12D (KC).

