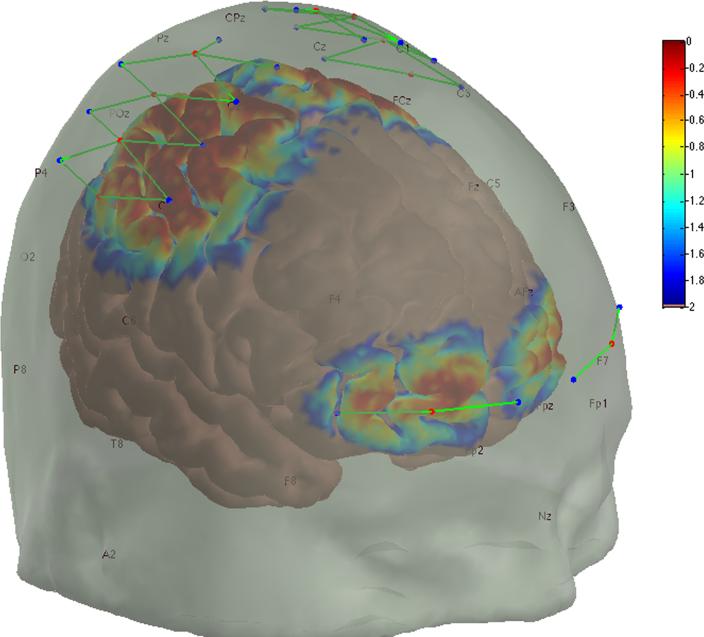
Figure 2. NIRS probe and sensitivity profile.
The fNIRS sensor array light sources (red dots), detectors (blue dots), and sensor channels (green lines) are shown at their intended locations. However, some shifting may occur for each subject, but has been shown to be sufficiently minimal in other studies where subject specific optode placements were measured. The sensitivity of the probe to detecting brain hemodynamics is shown as a temperature plot ranging from 1.00 (red) to 0.01 (blue) times the maximum sensitivity.

