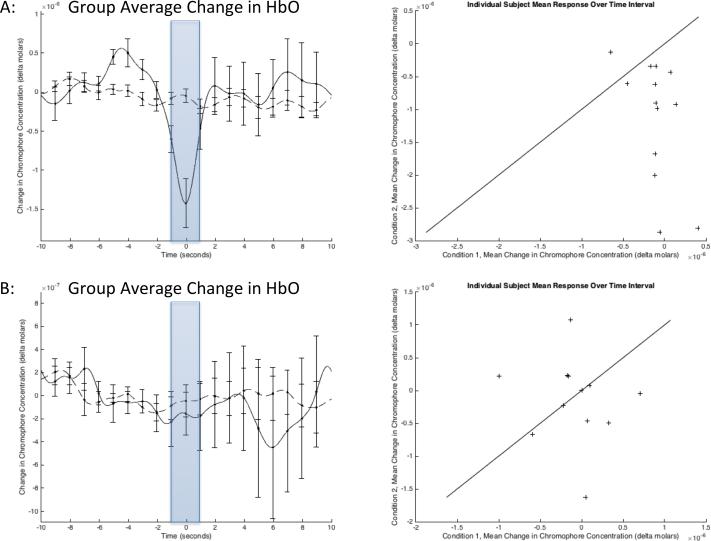
Figure 4. Average change in oxygenated hemoglobin for left and right frontal cortices.
Group-average change in oxygenated hemoglobin for the right and left hemispheres separately. The average value over the interval [−1, 1] (shaded) was used to perform paired t-tests. (a) The signals from the two left channels are the largest contributors to the insufflation response (p = 0.0053, n = 13). (b) The response observed on the right channels alone is non-significant (p = 0.8094, n = 11). The scatter plots on the right include a line with a slope of one and zero offset to help illustrate the trend in the data.

