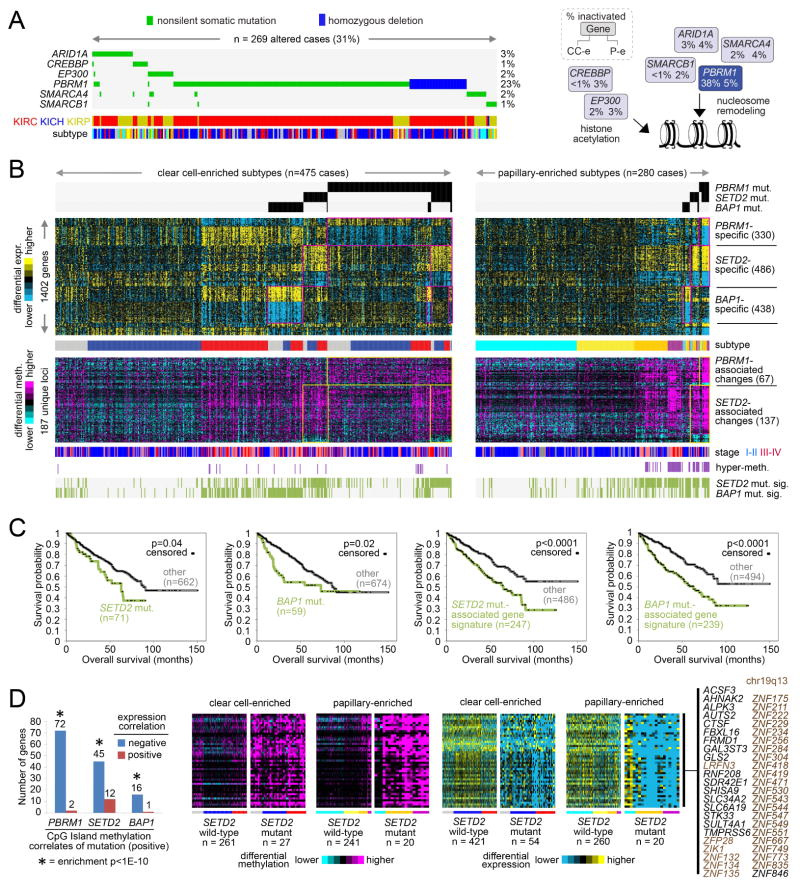
Figure 4. Widespread molecular changes associated with chromatin modifier mutation.
(A) The MEMo algorithm identified a pattern of mutually exclusive gene alterations (somatic mutations and copy alterations) targeting multiple components of the SWI/SNF complex and histone acetyltransferases EP300 and CREBBP (269 cases altered, 266 with exome data, or 31%). The alteration frequency for clear cell-enriched and papillary-enriched RCC subgroups (CC-e and P-e, respectively) is shown for each gene in the pathway diagram. (B) Global consequences of mutation in epigenetic modifiers PBRM1, SETD2, and BAP1. Yellow-blue heat map represents genes differentially expressed with nonsilent somatic mutation of PBRM1 in both clear cell-enriched and papillary-enriched RCC subgroups (p<0.001 in at least one of the two groups and p<0.01 in the other group, t-test; FDR<1%), with mutation of SETD2 in both subgroups, or with mutation of BAP1 in both subgroups. Purple-cyan heat map represents genomic loci (selected from the top 2000 most variable loci in Figure 2A, across 27K and 450K platforms) differentially methylated with nonsilent somatic mutation of PBRM1 in both clear cell-enriched and papillary-enriched RCC subgroups (p<0.001 in at least one of the two groups and p<0.01 in the other group) or with mutation of SETD2 in both subgroups. Cases manifesting gene transcription signatures related to SETD2 mutation or BAP1 mutation are denoted along the bottom (“SETD2 mut. sig.” and “BAP1 mut. sig.”, respectively). Numbers of cases represent RCC with both exome and RNA-seq data. (C) For clear cell-enriched and papillary-enriched genomic subtypes combined, differences in patient overall survival associated with SETD2 mutation, BAP1 mutation, SETD2 mutation-associated gene signature pattern, and BAP1 mutation-associated gene signature pattern, respectively. P-values by stratified log-rank test, adjusting for differences between clear cell-enriched and papillary-enriched cohorts. Numbers of cases represent patients from part A with survival data available. (D) For CpG Island methylation probes significantly increased with mutation of a specific chromatin modifier gene (p<0.001, t-test, for both clear cell-enriched and papillary-enriched cohorts, based on cases profiled on 450K arrays), significant numbers of associated genes showed a corresponding decrease in expression (p<0.01, t-test, both clear cell-enriched and papillary-enriched cohorts). Enrichment p-values by one-sided Fisher’s exact test. Corresponding patterns for genes showing coordinate methylation and expression changes between SETD2 mutant versus wildtype tumors are shown. See also Figure S4 and Table S6.

