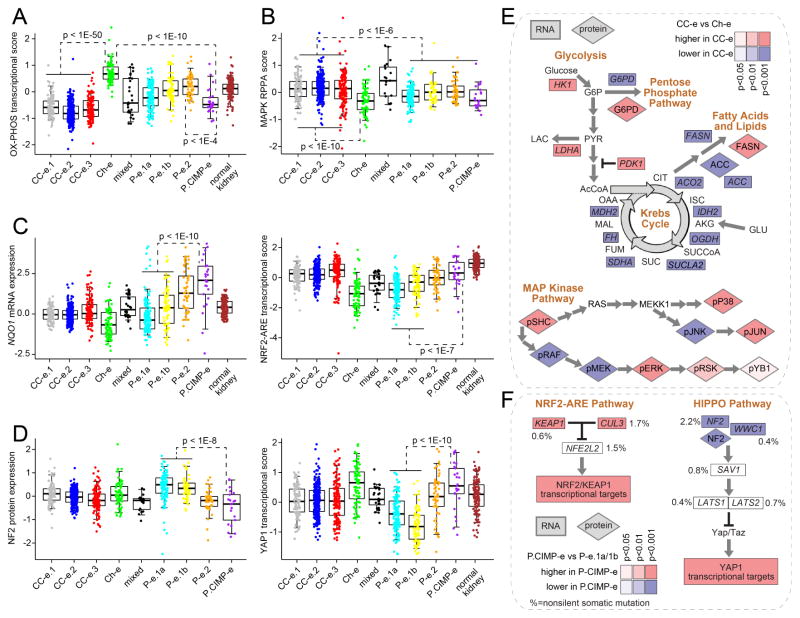
Figure 5. Differentially active pathways across RCC genomic subtypes.
(A) Differential aggregate expression of mRNAs (using normalized values) involved in oxidative phosphorylation among the genomic subtypes. (B) Differential MAP Kinase protein signaling among subtypes (by RPPA, average of phospho-SHC or pSHC, pRAF, pMEK, pERK, pSRK, pYB1, pP38, pJNK, and pJUN). (C) Differential mRNA expression of NRF2-ARE pathway marker NQO1 (left, normalized values) and differential aggregate expression of NRF2-ARE transcriptional targets (right). (D) Differential protein expression of HIPPO pathway regulator NF2 (left) and differential aggregate expression of downstream YAP1 transcriptional targets (right). (E) Differential expression patterns of clear cell-enriched RCC subtypes (“CC-e”) versus Ch-e tumors in metabolism- and MAPK-related pathways. (F) Differential expression patterns of P.CIMP-e tumors versus P-e.1a/1b tumors in NRF2-ARE- and HIPPO-related pathways. Percentages denote nonsilent mutation frequency across all RCC cases. For parts A–F, p-values for indicated comparisons by t-test on log-transformed data. Box plots represent 5%, 25%, 50%, 75%, and 95%. Normal kidney samples were not represented on RPPA platform. See also Figure S5.

