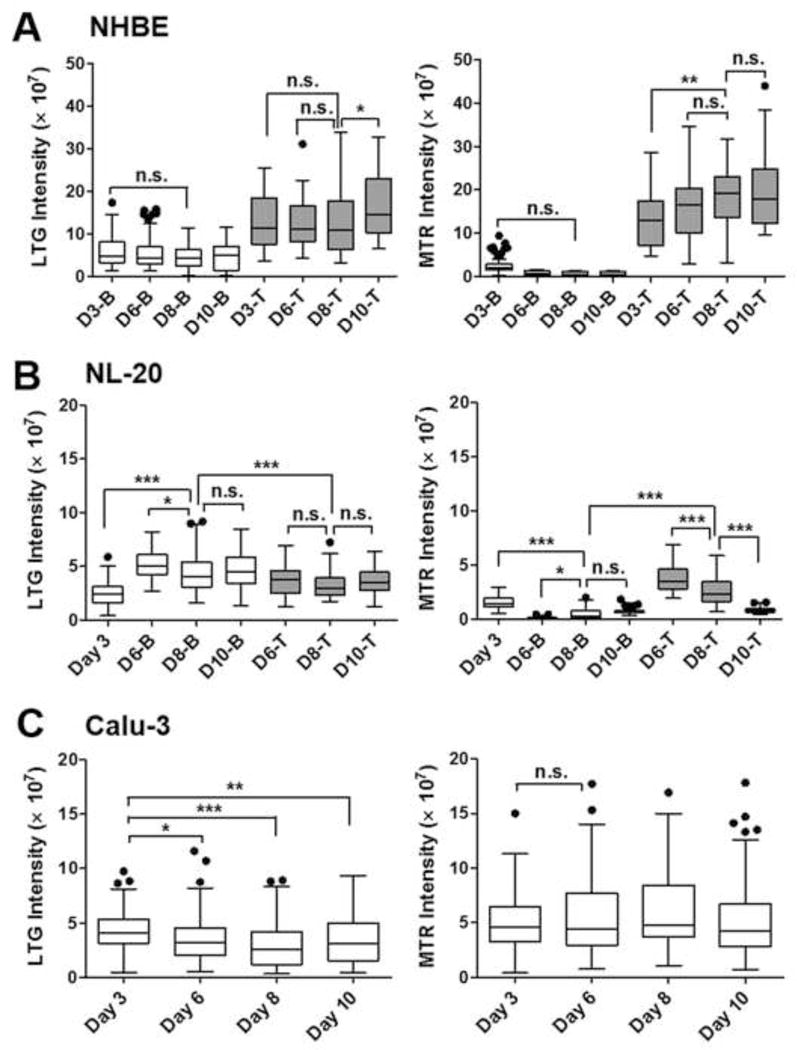
Fig. 4.

Fluorescence intensity measurements of probes staining suborganelles in three different human lung epithelial cell-types ((A) NHBE, (B) NL-20, (C) Calu-3) on different days of cultures under the ALI conditions. Integrated intensity values of LysoTracker® Green DND-26 (LTG) and MitoTracker® Red (MTR) were measured for top or bottom cell layers in NHBE or NL-20 and the Calu-3 cell monolayer on days 3, 6, 8, and 10 by the Metamorph. Box-whisker plots showing median and interquartile range with whisker ends are depicted after the post-hoc multiple mean comparison (Tukey’s test, p<0.05). Statistical analyses were performed with Tukey’s multiple comparison test with the 5% significance level. n.s.=not significant, *p<0.05, **p<0.001, ***p<0.0001.
