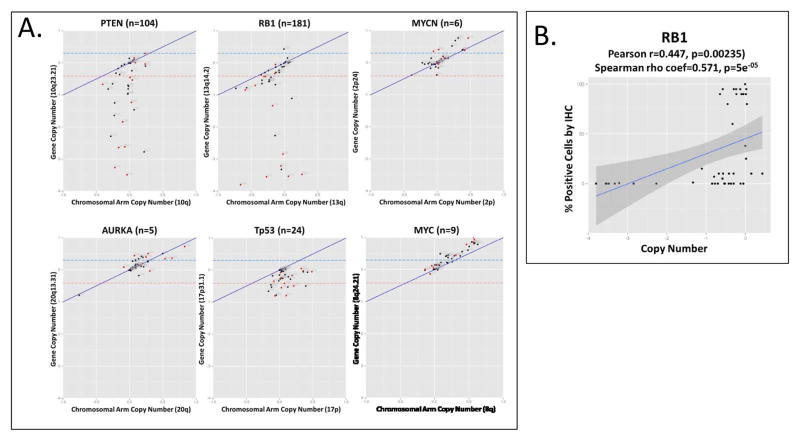
Figure 2. Copy number alterations at genes of interest and correlation with IHC results.
(A) Segmental (values corresponding only to the gene of interest) vs regional (median values for the corresponding chromosome arm) copy number calls for PTEN, RB1, MYCN, AURKA, Tp53 and MYC. “n” in parenthesis following the gene name indicates the number of gene-specific probes present on the Oncoscan® chip. The blue and red dashed lines indicate the absolute cutoff values. The solid blue line represents the corresponding chromosome arm copy number. Red dots indicate samples with SCPC morphology. (B) Correlation between labeling indices (y-axis) and copy number (x-axis) for RB1.

