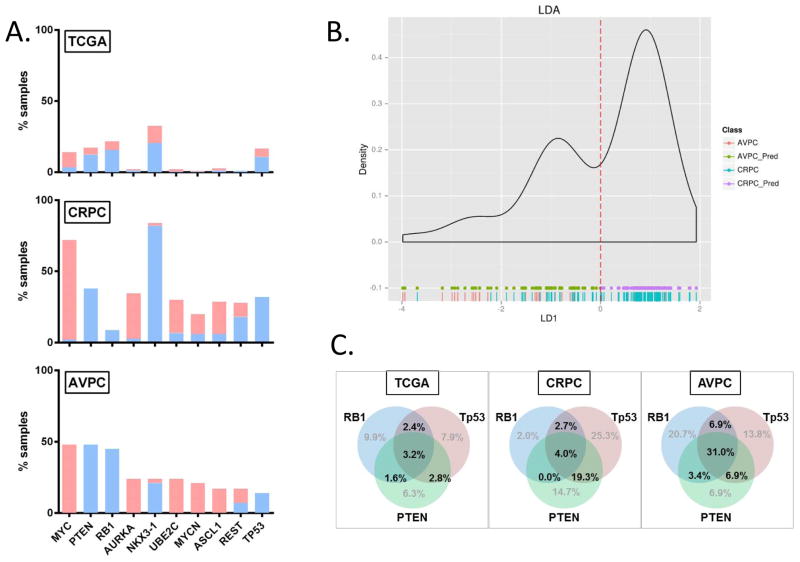
Figure 4.
AVPC data with reference to publicly available TCGA and unselected CRPC data sets.
(A) Histograms showing percentage of samples with CNA (per absolute cutoffs) at segments corresponding to genes of interest in TCGA, unselected CRPC (middle) and AVPC 7. In blue are copy number losses and in red are copy number gains. (B) Linear Discriminant Analysis of AVPC and unselected CRPC samples using the 10-CNA-marker set. Green and purple dots at the bottom indicate predicted AVPC (AVPC_Pred) and non-AVPC (CRPC_Pred) predictions respectively while red and blue vertical lines indicate actual AVPC and unselected CRPC samples respectively. (C) Venn diagrams showing the rates of combined RB1, Tp53 and/or PTEN alterations in the TCGA (n=253), CRPC (n=150) and AVPC (n=29) samples.

