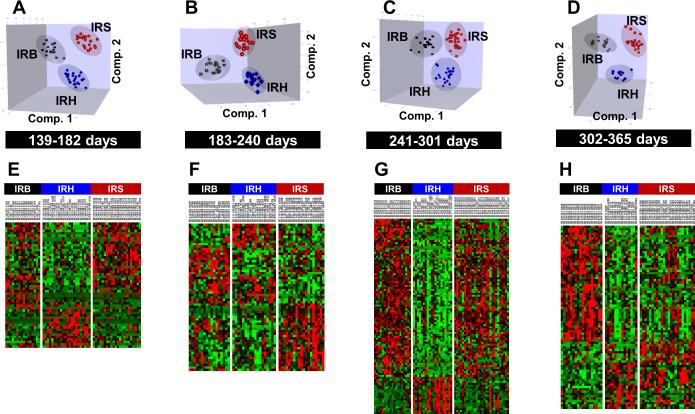
Figure 2.
(A-D) Comparison of feature profiles in mice exposed to 5.4Gy radiation over four defined time periods within 1 year. The 3D graphs are the scores plots of OPLS-DA using ~11,900 features that passed the intensity filter in arbitrary orientations. (E-H) Heat maps of the top selected features by template matching to distinguish IRB, IRH and IRS (52, 61, 100, 79 features respectively over four defined time periods). Relative changes are shown after centering and scaling. Green – Black – Red scale is from −0.2 to +0.2 where black is mean value of the feature.

