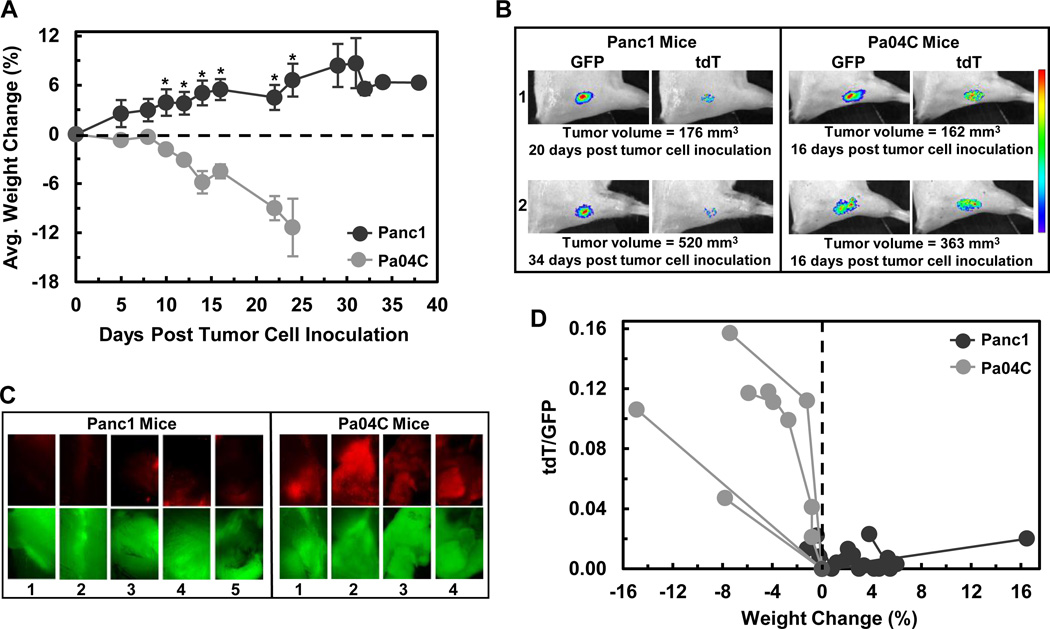
Figure 2.
Weight loss and induction of tdT fluorescence in To3B muscle grafts were pancreatic tumor cell line dependent. (A) Average magnitude of percent of weight changes for the 4 mice with Pa04C and 5 mice with Panc1 evaluated throughout the course of the study. The weight changes of mice with Panc1 tumors were significantly higher than mice with Pa04C tumors from day 10 onwards with *p ≤ 0.05 (Student t-test). Error bars represent ±1 SEM. The last weight change of the remaining Panc1 mouse stands alone. (B) Representative GFP and tdT fluorescent images of To3B myoblast grafts of representative mice labeled 1 and 2 of each group. Note that the tumor sizes were similar and yet the tdT fluorescence from Panc1 tumor bearing mice was very low. Thus, a strong induction of tdT fluorescence was tumor type dependent. The heat map at the right is a qualitative presentation of fluorescent intensities that range from purple (dimmest) to red (brightest). All of the fluorescence areas represent quantifiable ROIs as automatically determined and evaluated in absolute units of total Radiance Efficency by Live Image® 4.2 software. (C) Ex vivo GFP and tdT fluorescent photomicrographs of To3B graft sites in dissected muscle. GFP fluorescence was recorded from To3B graft site of all Panc1 mice and Pa04C mice. Strong red tdT fluorescence was seen only in To3B grafts of Pa04C mice. Images were obtained on an inverted microscope using a 2× objective. (D) Graphical representation of tdT/GFP signal ratios versus percent weight changes. The tdT/GFP ratios for Panc1 mice were low or zero and clustered near or within the positive percent weight change region (weight gain) while tdT/GFP ratios of Pa04C mice were on average ~9× higher and were within the weight lost region.

