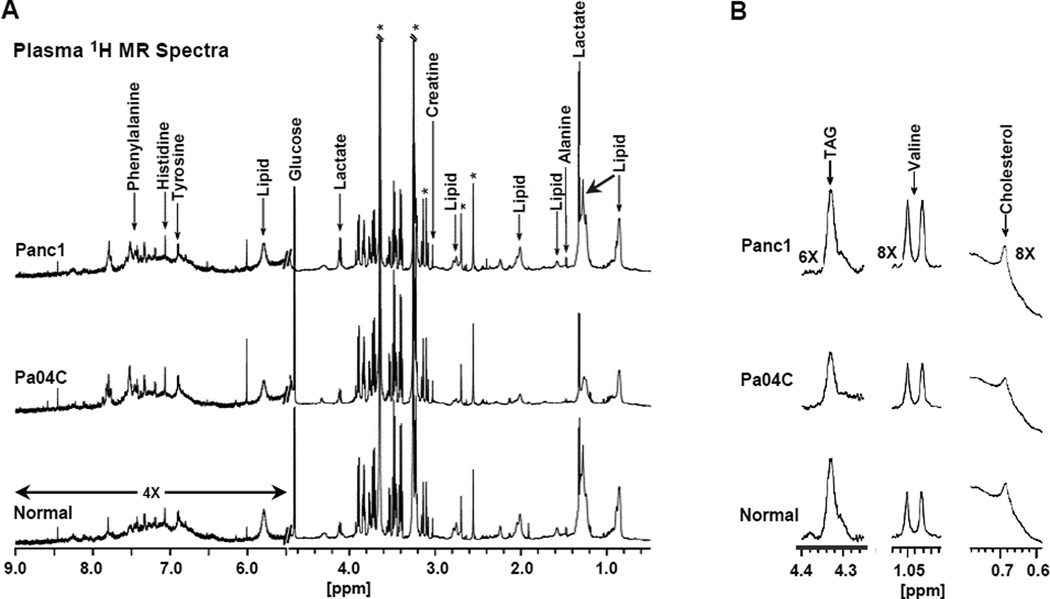
Figure 4.
1H MR spectroscopic analysis of plasma samples from normal and Panc1 and Pa04C tumor bearing mice. (A) Typical pre-saturation water suppressed 1H CPMG MR spectra of mouse plasma. The CPMG sequence minimized the short T2 signals from proteins. The downfield region (5.5 – 9.0 ppm) represents a 4× vertical zoom as compared to the up-field region (0.5 – 4.5 ppm). *Denotes signal from EDTA. (B) As indicated, 6× or 8× vertical zoom of the appropriate 1H MR spectral regions showing changes in plasma levels of TAG and cholesterol in lipoproteins, and in plasma levels of valine, in Pa04C, Panc1 tumor bearing mice, and normal mice.

