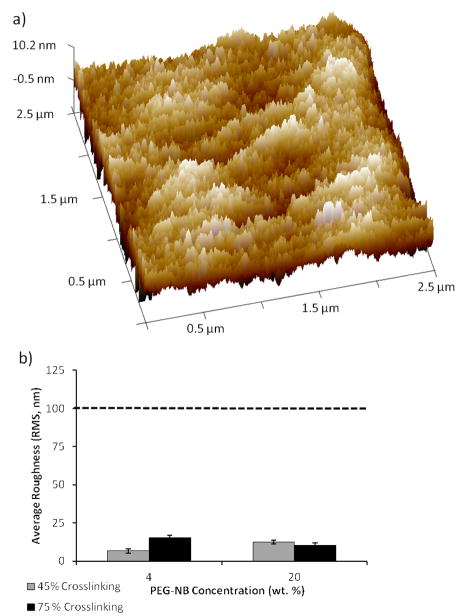
Figure 2.
Characterization of surface roughness of hydrogels formed using the array formation procedure. (a) Representative AFM height image of hydrogel (shown: 20 wt.%, 45% crosslinking) in liquid to determine the RMS roughness. (b) The calculated RMS roughness values (6.6–15.1 nm) for hydrogels with the lowest and highest stiffness values formed using this array formation procedure. Dotted line denotes minimum height used in previous studies investigating the influence of nanotopography of compliant surface on hMSC behavior. Sample size: n = 3 (b).

