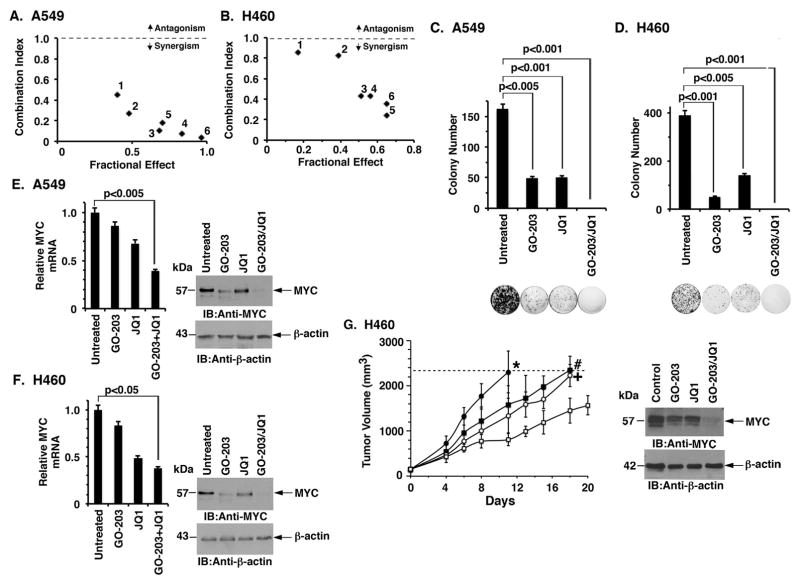
Figure 6. GO-203 is synergistic with JQ1 in the treatment of KRAS mutant NSCLC cells.
A and B. The indicated A549 (A) and H460 (B) were treated with (i) GO-203 alone each day for 72 h, (ii) JQ1 for 72 h, or (iii) GO-203 combined with JQ1 for 72 h. Numbers 1 to 6 in the graphs represent combinations listed in Supplemental Tables S3A and B. Mean cell survival was assessed in triplicate by CellTiter-Glo® One Solution assays. C and D. The indicated A549 (C) and H460 (D) cells were seeded at 1000 cells/well (6-well plate), left (i) untreated, (ii) treated with 2 μM of GO-203 alone every 24 h, (iii) 5 μM of JQ1 alone every 72 h, or (iv) the combination of GO-203 and JQ1. After 10 d, the cells were stained with crystal violet. Colony number (>25 cells) is expressed as the mean±SD of three replicates. E and F. A549 (E) and H460 (F) cells were treated with 2 μM of GO-203 or/and 5 μM of JQ1 for 72 h. Cells were analyzed for MYC mRNA levels by qRT-PCR (left). The results (mean±SD of three determinations) are expressed as relative MYC mRNA levels as compared to that obtained for the untreated cells (assigned a value of 1). Lysates from the indicated cells were immunoblotted with antibodies against MYC and β-actin (right). G. Mice bearing established H460 tumor xenografts (~150 mm3) were treated IP with daily administration of control vehicle (closed circles), 12 mg/kg GO-203 (closed squares), 50 mg/kg JQ1 (open circles) or the GO-203/JQ1 combination (open squares). The results are expressed as tumor volume (mean±SEM; 5 mice/group)(left). Statistical analysis (Student’s t-test) comparing the results from the GO-203/JQ1 combination-treated group with those from the (i) control group, p=0.011 (*); (ii) GO-203 group, p=0.033 (#); and (iii) JQ1 group, p=0.016 (+), where p<0.05 is significant. Tumor lysates from control (day 11) and the treated mice (day 18) were immunoblotted with the indicated antibodies (right).

