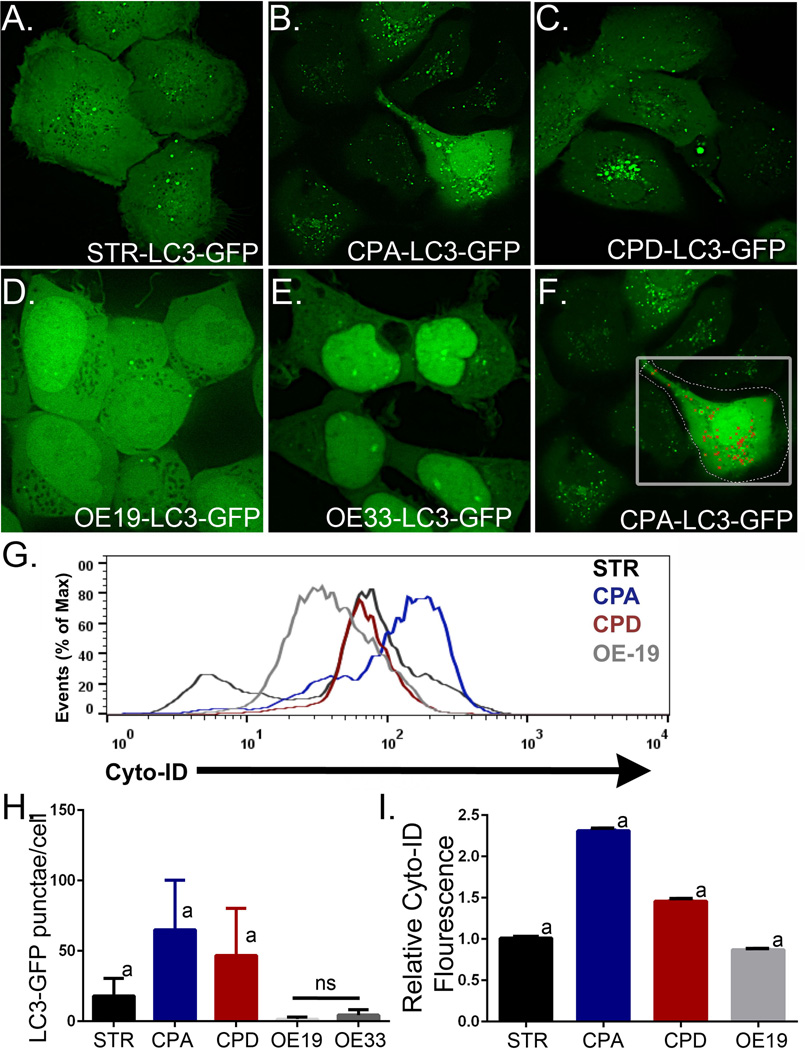
Figure 2. LC3-GFP fluorescence-mediated identification of autophagic vacuoles in human Barrett’s esophagus cell lines.
STR, CPA, CPD, OE19, and OE33 cell lines were retrovirally transduced to express LC3B-GFP. All cell lines were maintained in basal growth media. Cells were imaged by epifluorescence microscopy to visualize fluorescent AV puncta, indicating autophagic vesicles [36]. A. Normal human esophageal squamous keratinocyte STR cells. B. Non-dysplastic Barrett’s Esophagus CPA cells. C. Dysplastic Barrett’s Esophagus CPD cells. D. Barrett’s-associated Esophageal adenocarcinoma OE19 cells. E. Barrett’s-associated esophageal adenocarcinoma OE33 cells. F. Demonstration of Volocity (Perkin Elmer)-medicated identification and counting of fluorescent AV puncta. G. Cyto-ID Autophagy fluorescence histogram of four cell lines STR (Black), CPA (Blue), CPD (Red), and OE19 (Grey) after gating on E-cadherin+ cells. H. Fluorescent AV puncta counts per cell. Counts were made on 36 to 55 separate cells for each cell line imaged. a=significantly differs from all other cell lines by 1 way ANOVA testing and Tukey’s Multiple Comparison Testing p<0.05. ns= not significantly different from each other. I. Summary of FACs quantitation of Cyto-ID Autophagy fluorescence in cell lines maintained under growth conditions. n=3 for each cell line. a=significantly differs from all other cell lines by 1 way ANOVA testing and Tukey’s Multiple Comparison Testing p<0.05.

