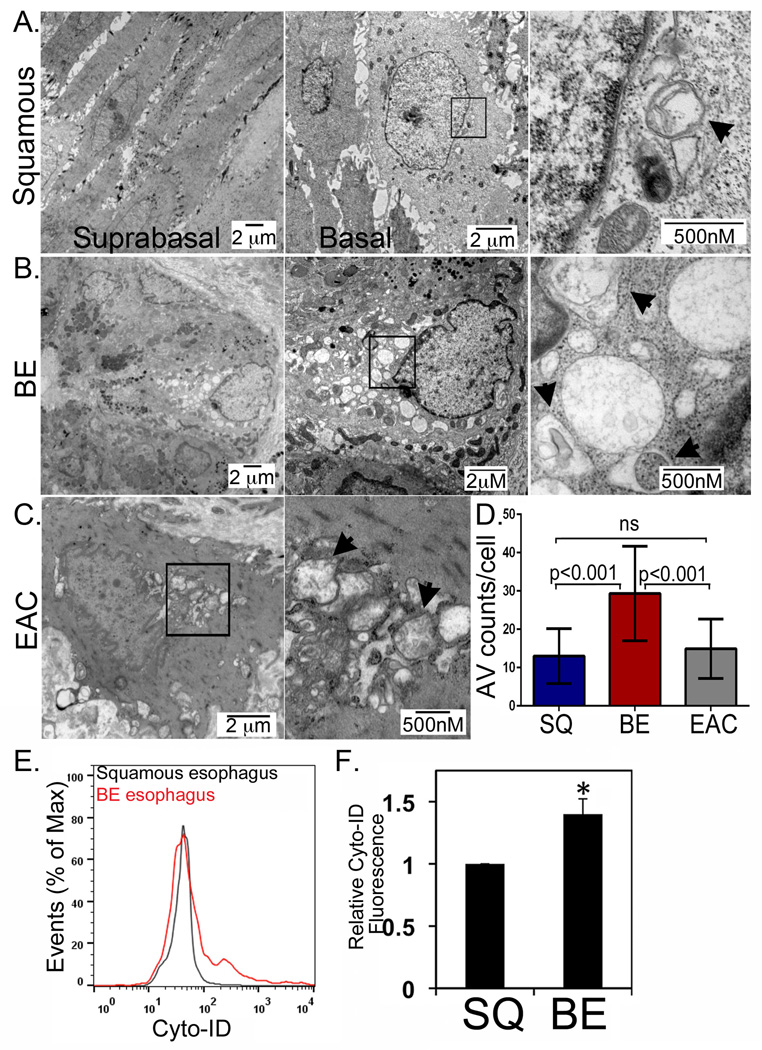
Figure 3. Steady-state levels of AV in normal human squamous epithelium, BE, and EAC.
A. Human squamous esophagus examined by TEM under increasing magnification. Black box-region extremely magnified in frame to the left. B. Barrett’s esophagus TEM by increasing magnification. Black box-region extremely magnified in frame to the left. C. Human EAC imaged by TEM under increasing magnification. Black box-region extremely magnified in frame to the left. D. Counts of AVs in 74 or more cells per patient sample were obtained averaged across all patient samples, with the average number of AVs per cells graphed. SQ: squamous; BE: Barrett’s esophagus: EAC: esophageal adenocarcinoma. One-way ANOVA and Tukey Rank mean with q< 0.005, n=9 subjects/198 cells, 5 subjects/112 cells, and 3 subjects/74 cells for squamous, BE, and EAC samples, respectively. E. Autophagic vesicles quantified by Cyto-ID stain and flow cytometry in the Barrett’s (Red) and squamous epithelium (Black) from a single subject. F. Averaged relative Cyto-ID fluorescence from three subjects for squamous esophagus and BE tissue. *, p<0.05.

