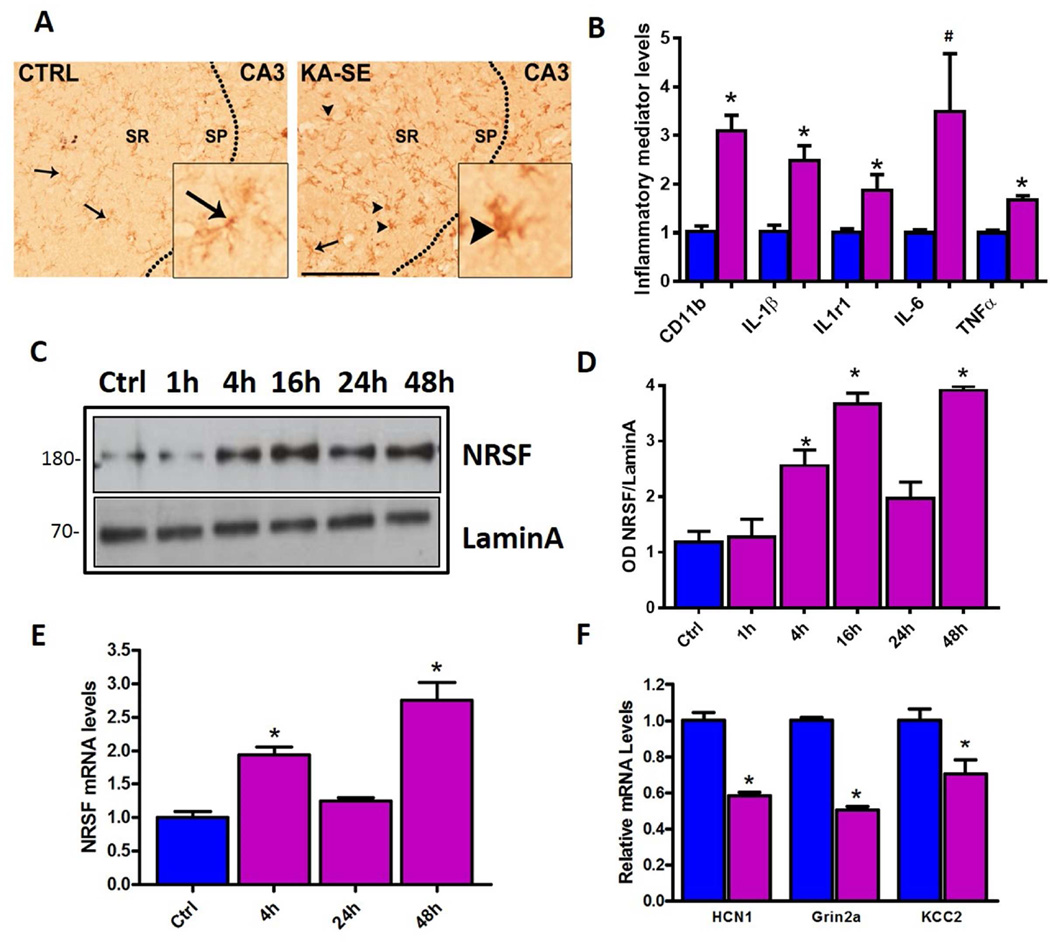
Figure 1. Concurrent induction of inflammatory mediators and NRSF expression by epilepsy-provoking status epilepticus.
Microglia activation in KA-SE rat hippocampus (A). Compared with control hippocampus, where the microglial marker IBA1 is found in wispy ramified cells, (inset) microglia in KA-SE hippocampus appear globular (arrowheads). Sp, sr, strata pyramidale and radiatum. Bar= 100µm. (B). KA-SE induced mRNA expression of inflammatory markers CD11b, and pro-inflammatory cytokines in hippocampus as detected by qPCR n=4/group. *= p<0.05, #p=0.07. (C) Representative W. blot showing NRSF protein levels from hippocampal nuclear fractions. NRSF levels increased at 4h following SE and remained elevated at 48h. One hippocampus per lane, n=5 animals/time-point. (D) Densitometric analysis of NRSF protein levels after KA-SE, normalized and compared to control. (E) qPCR analysis of NRSF mRNA expression in control hippocampus and following KA-SE shows upregulation of NRSF compared to control, n=9/group. (F) Repression of NRSF target genes including HCN1, GRIN2A and KCC2 at 48h post SE, n=4/group.

