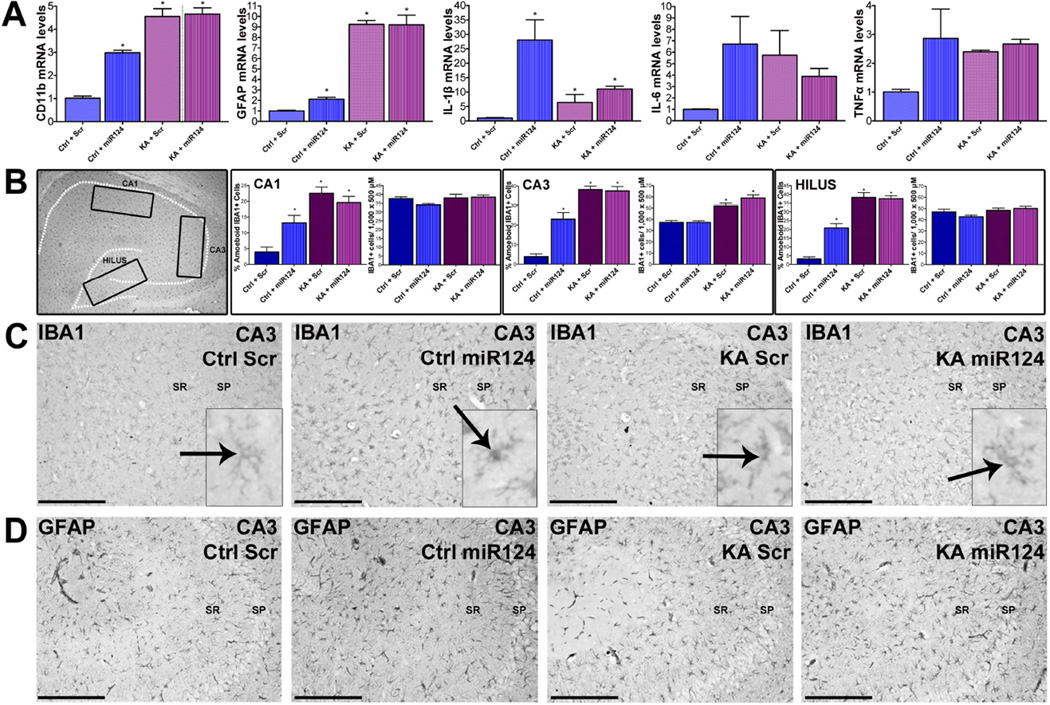
Figure 6. MiR-124-induced inflammatory cascades and microglia activation.
(A) Hippocampal cytokine mRNA levels, including IL-1β, TNF-α, IL-6 and IL-1 receptor and CD11b, were dramatically increased by miR-124 but not scr treatment in control brain. KA-SE increased inflammatory markers (including the astrocytic marker GFAP). (B,C) ICC and quantification of total and activated microglia. Insets denote the regions assessed in C. In control hippocampus, miR124 increased the activation of microglia, assessed as a transformation of IBA1-cells from thin and ramified into globular. (Ctrl-miR124; inset). No change in total IBA1-expressing cells was noted in areas CA1, CA3 and the DG hilus. Microglia activation was not found in control rats given a scr agomir (Ctrl+Scr, inset). Moderate microglia activation was observed in KA-SE rats. (D) In contrast to microglia, astrocytes did not seem to be affected by miR-124 agomir infusion. As expected, astrocytes were activated by KA-SE. n=5/group.

