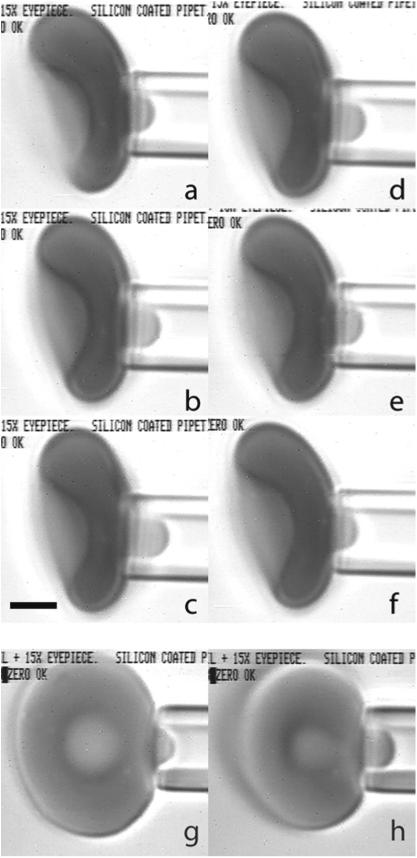
Fig. 4.
A red blood cell being aspirated into a micropipette. Pipettes were made by pulling capillary tubing to a point and using a microforge to produce a flat tip of the desired diameter. The inside diameter was measured using a calibration needle inserted into the tip. The maximum insertion depth was measured, and the corresponding diameter (1.70 μm) was determined from electron micrograph images of the probe. Pressure was applied to the surface of the cell by using a micrometer to adjust the height of a water manometer relative to zero pressure, which was determined by observing the movement of small particles within the empty pipette lumen. For a typical measurement series, the cell was aspirated near the dimple region of the biconcave disk (a–f). Suction was increased stepwise to a maximum of approximately 30Pa and then decreased stepwise to a minimum pressure of approximately 7.4Pa. Images were recorded on videotape, and frames were captured subsequently for data analysis. At each pressure step, the length of the projection was measured. Six example images are shown for an individual cell at different pressures: a–c increasing pressures of 12.3, 19.6 and 29.4Pa; d–f decreasing pressures of 19.6, 12.3 and 7.3Pa. Observation of the transition from the cell membrane contacting the front face of the pipette to contacting the interior of the pipette cylinder is more easily seen when a cell is aspirated on edge (g, h). This transition (for this particular experiment) typically took place between aspiration pressures of 7.3 and 12.3Pa. The pressure in g (pre-transition) is 9.8Pa, and in h (post transition) is 14.7Pa. Scale bar (c) is 2.0 μm

