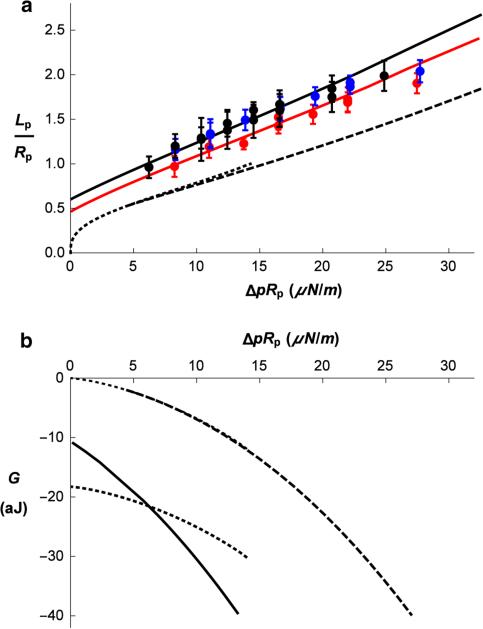
Fig. 5.
a Aspiration length of the RBC (Lp/Rp) as a function of pipette aspiration pressure (ΔpRp) for the pipette radius Rp = 0.85 μm. Points are average values of the measured projection length at each pressure taken from nine or ten different cells, and error bars indicate the standard deviation. Each different color corresponds to a different day of experiments. For the black data points, the pipette diameter was 1.7 μm, and for the red and blue data points, the pipette diameter was 1.1 μm. The lines show corresponding theoretical predictions. Dotted line represents aspiration of the RBC without forming a cylindrical part inside the pipette (Lc = 0). Dashed line represents the equilibrium aspiration lengths versus the aspiration pressure obtained by Eq. 22 with no adhesion (σeff = 0). The thick black line presents a rough visual fit to the data for the larger pipette, and the red curve is a visual fit to the red data points from a smaller pipette. Parameters for the solid black line are K = 30 μN/m and σeff = −0.277, and for the red curve, K = 30 μN/m and σeff = −0.225. b Free energy G of the aspirated RBC (Eq. 19) as a function of the aspiration pressure. Dotted lines represent the energy of the RBC without a cylindrical section inside the pipette (Lc = 0), the upper for σeff = 0 and the lower for σeff = −0.277, i.e., the value at which the Lc = 0 curve was found to cross the curve with Lc ≠ 0. Dashed line presents the energy for Lc > 0 and the adhesion constant σeff = 0. Full line presents energy that corresponds to the solid black line in (a)

