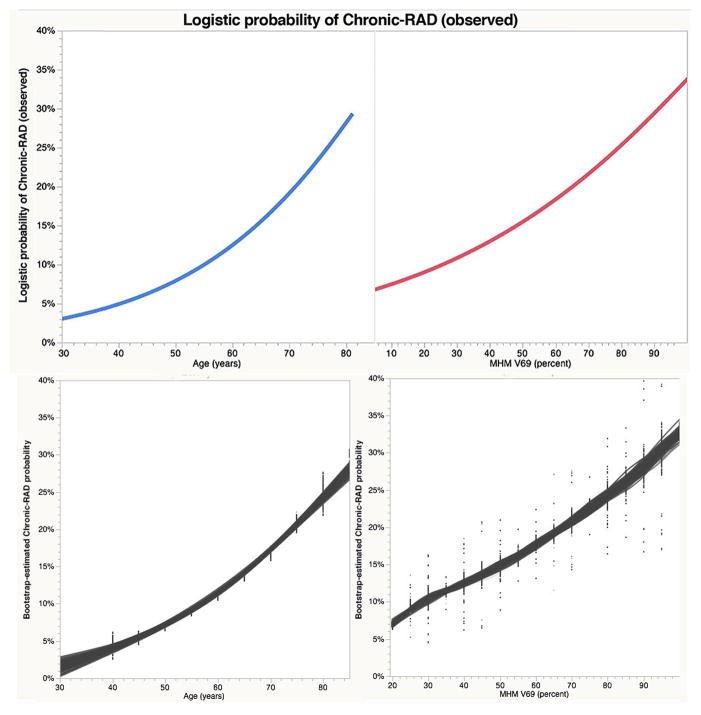
Figure 3. Observed and Predicted probabilities of chronic-RAD by age and MHMV69.
Observed nominal logistic continuous variable regressor-response plots for age (3a) and MHM V69 (3b). Bootstrap estimated population probability of Chronic-RAD plots for age (3c) and MHM V69 (3d); points are shown in 5 Gy/5-year “bins” with gray lines representing unsupervised fits across 104 resampled distribution, indicative of the expected range of uncertainty attributable to differentials between the observed sample and the parent oropharyngeal cancer patient true population.

