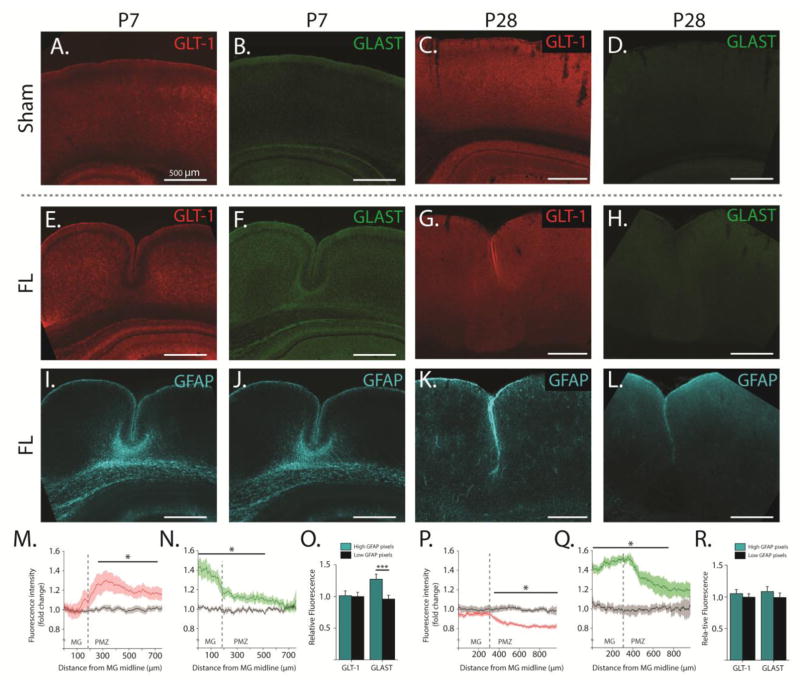
Figure 4. Glutamate transporter expression and distribution are altered by FL.
AD, Pseudo-colored epifluorescence images of GLT-1 (red) and GLAST (green) immunoreactivity in sham-injured cortex at P7 (left) and P28 (right). E–H, Pseudo-colored epifluorescence images of GLT-1 (red) and GLAST (green) immunoreactivity in FL cortex at P7 (left) and P28 (right) showing the microgyrus and PMZ. I–L, Pseudo-colored epifluorescence images of GFAP co-stain (cyan) in the same FL sections shown in E–H. M, Average fold change in GLT-1 immunoreactivity across the deep layers of the P7 cortex (compared to isotopic sham-injured cortex) at specified distances from the midline of the microgyrus (MG). N, Average fold-change in GLAST immunoreactivity across the deep layers of the P7 cortex (compared to isotopic sham-injured cortex) at specified distances from the midline of the microgyrus (MG). O, Relative GLT-1 and GLAST expression in regions of high GFAP expression (cyan bars) compared to regions with low GFAP expression (black bars) in P7 cortex. High and low GFAP regions were defined by a GFAP expression threshold applied on a pixel-by-pixel basis. P, Average fold-change in GLT-1 immunoreactivity across the deep layers of the P28 cortex (compared to isotopic sham-injured cortex) at specified distances from the midline of MG. Q, Average fold change in GLAST immunoreactivity across the deep layers of the P7 cortex (compared to isotopic sham-injured cortex) at specified distances from the midline of MG. Q, Relative GLT-1 and GLAST expression in regions of high GFAP expression (cyan bars) compared to regions with low GFAP expression (black bars) in P28 cortex. Error bars represent SEM, scale bars are 500 μm, * p < 0.05, *** p < 0.001, two-sample t-test.

