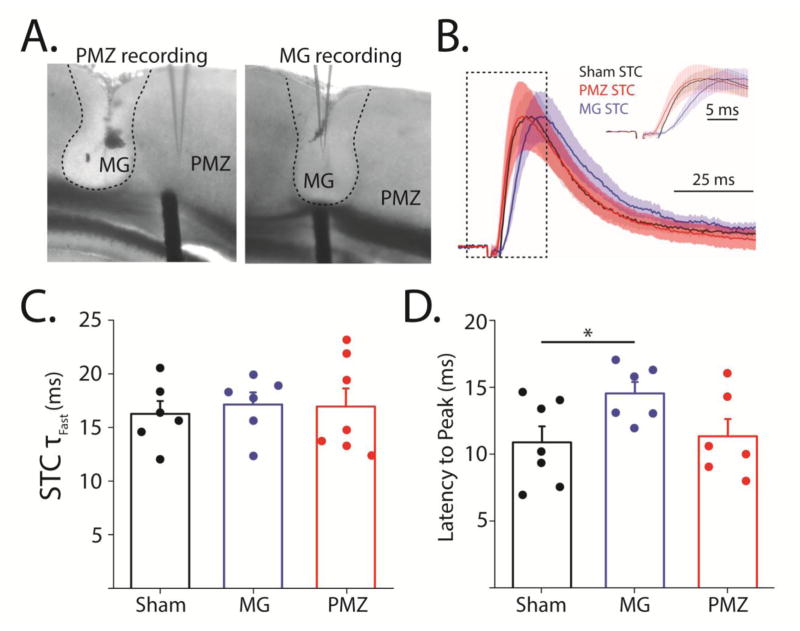
Figure 5. Synaptically-evoked glutamate transporter current decay kinetics are not affected by FL, but the latency to peak is increased in the microgyrus.
A, DIC images of lesions showing placement of stimulator and recording electrodes for PMZ (left) and microgyral (MG) recording (right). Edge of the lesion is denoted by dashed line. B, Peak normalized averages of all PMZ (red), MG (blue), and sham-injured (black) STCs with shaded area showing ± SEM. Inset shows an expansion of the area show in the dashed box. C, Average (bar) and individual (circle) fast decay time constants of STCs evoked in sham-injured, MG, and PMZ astrocytes. D, Average (bar) and individual (circle) latencies to STC peaks in sham-injured, microgyral, and PMZ astrocytes. Error bars represent SEM, * p < 0.05, two-sample t-test.

