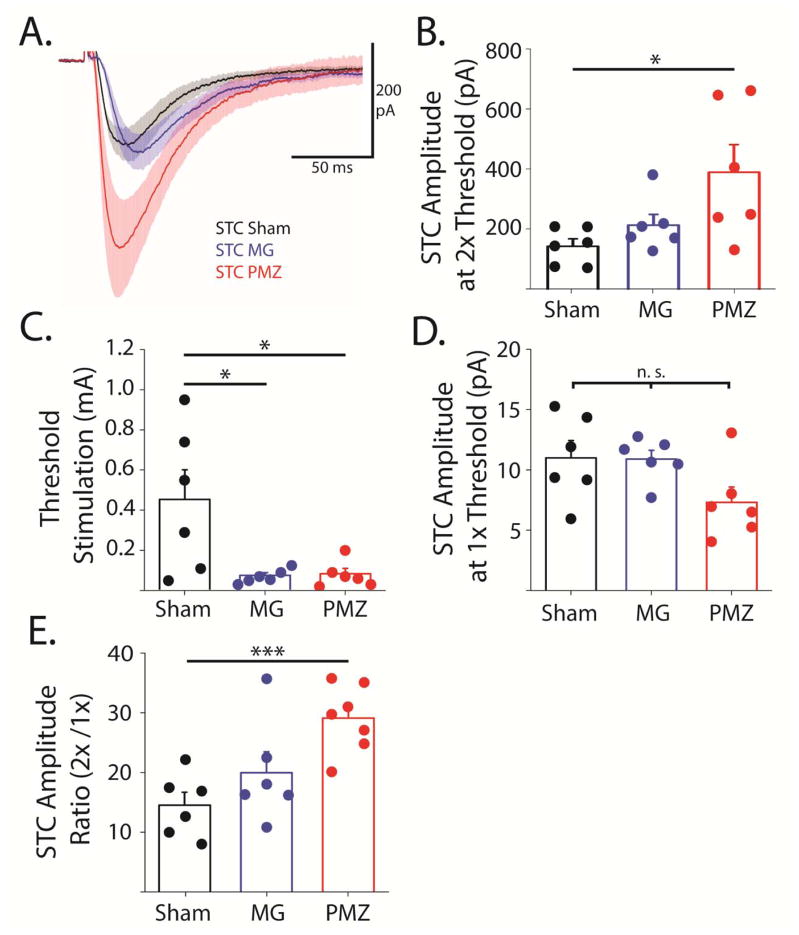
Figure 6. Synaptically-evoked glutamate transporter current amplitudes are greater in paramicrogyral zone though threshold stimulation intensity is lower.
A, Average STCs from PMZ (red), microgyral (MG, blue), and sham-injured (black) astrocytes. Shaded area shows SE. B, Averages (bars) and individual amplitudes of STCs with stimulation intensity at 2X threshold. C, Averages (bars) and individual threshold stimulation intensities. D, Averages (bars) and individual amplitudes of STCs with stimulation intensity at 1X threshold. E, Averages (bars) and individual ratios of STC amplitudes at 2X threshold relative to 1x threshold. Error bars represent SEM, * p < 0.05, ** p < 0.01, *** p < 0.001, two-sample t-test.

