
Figure 1.
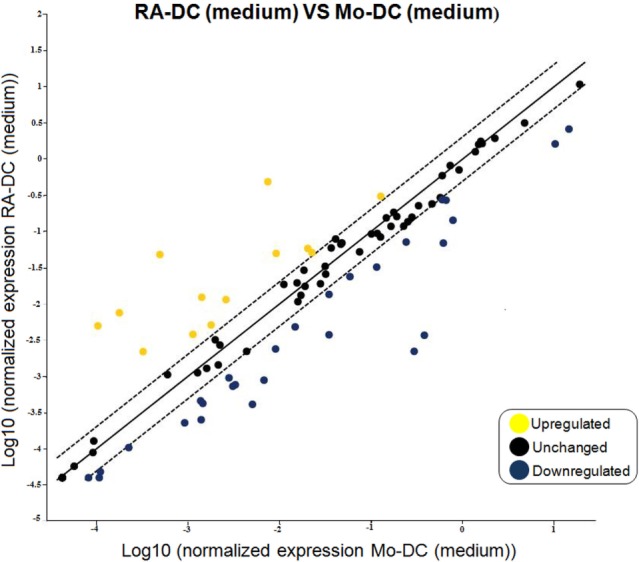
RA treatment imprints down-regulation in gene expression of dendritic cells. RT2 PCR arrays were performed on the RNA extracted from RA-DC and Mo-DC at day 6 of culture. Scatter plots shows the fold change of the gene expression of the RA-DC in culture medium in comparison to that of the Mo-DC in culture medium. Upregulated genes are shown in yellow, downregulated genes are shown in blue, and unchanged (less than twofold change) genes in black.